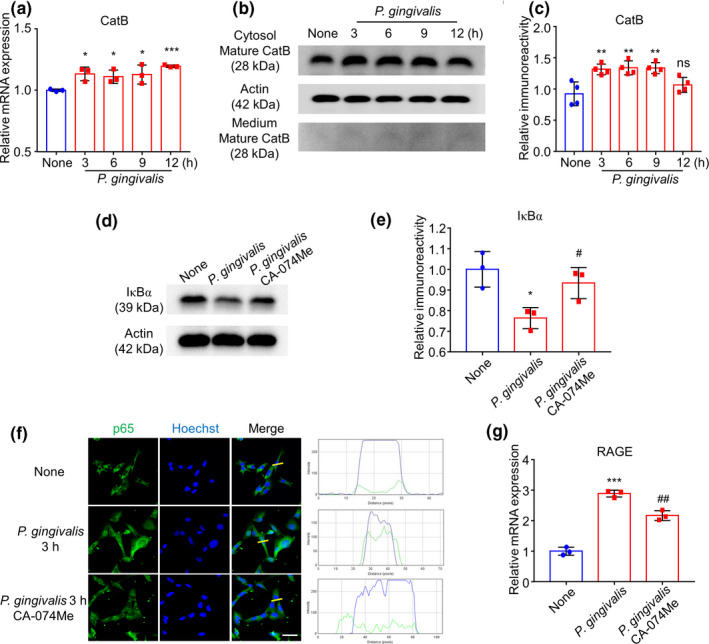
FIGURE 3.

CatB/NF‐κB pathway regulated late‐phase expression of RAGE after P. gingivalis infection. (a) The mean mRNA expression level of CatB of cultured hCMEC/D3 cells increased after P. gingivalis infection (n = 3 independent cell culture preparations, *p < .05, ***p < .001; one‐way ANOVA). Asterisks indicate a statistically significant difference versus “None” group. (b) The immunoblots show mature CatB in cytosol and medium in hCMEC/D3 after P. gingivalis infection. (c) The quantitative analysis of cytosol CatB in (b) (n = 4 independent cell culture preparations, ns: no significant difference, **p < .01; one‐way ANOVA). Asterisks indicate a statistically significant difference versus “None” group. (d) The effect of CA‐074Me, a specific CatB inhibitor, on IκBα degradation after P. gingivalis infection for 12 hr. (e) The quantitative analysis of (d) (n = 3 independent cell culture preparations, *p < .05, # p < .05; one‐way ANOVA). Asterisks indicate a statistically significant difference versus “None” group and pounds indicate a statistically significant difference versus “P. gingivalis” group. (f) The effect of CA‐074Me on the nuclear translocation of p65 (green) in hCMEC/D3 cells with Hoechst‐stained nuclei (blue) at 3 hr after P. gingivalis infection. Scale bar, 50 μm. (g) The effect of CA‐074Me on the mRNA expression of RAGE in hCMEC/D3 cells after P. gingivalis infection (n = 3 independent cell culture preparations, ***p < .001, ## p < .01; one‐way ANOVA). Asterisks indicate a statistically significant difference versus “None” group and pounds indicate a statistically significant difference versus “P. gingivalis” group
