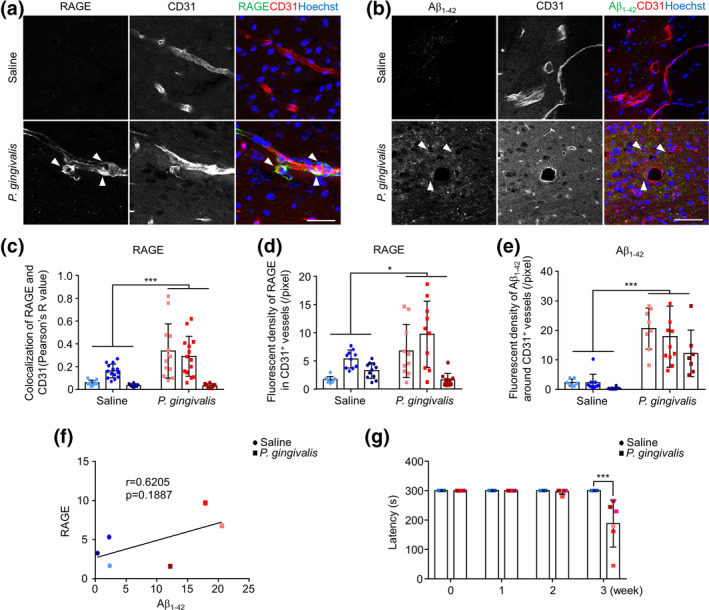
FIGURE 6.

Increased RAGE expression in cerebral endothelial cells and the induction of Aβ1‐42 around cerebral endothelial cells of mice after systemic P. gingivalis infection. (a) The immunofluorescent CLMS images of brain slice stained with RAGE (green), CD31 (red), and Hoechst (blue) after systemic P. gingivalis infection. (b) The immunofluorescent CLMS images of brain slice stained with Aβ1‐42 (green), CD31 (red), and Hoechst (blue) after systemic P. gingivalis infection. (c) Co‐localization analysis of RAGE and CD31 in the images in (a) using COLOC 2 plugin. (d)The quantitative analysis of RAGE fluorescence density in CD31+ vessels in the images in (a). (e) The quantitative analysis of Aβ1‐42 fluorescence density around CD31+ vessels in the images in (b). (f) Pearson's correlation between the fluorescence density of RAGE and Aβ1‐42. (a–f) Three mice per group were used and each mouse has its own color. (g) Memory decline in mice after 3 weeks of systemic P. gingivalis infection (n = 6 mice/group). Asterisks indicate a statistically significant difference versus “Saline” group using multiple t‐test. *p < .05, **p < .01, ***p < .001. Scale bar, 50 μm
