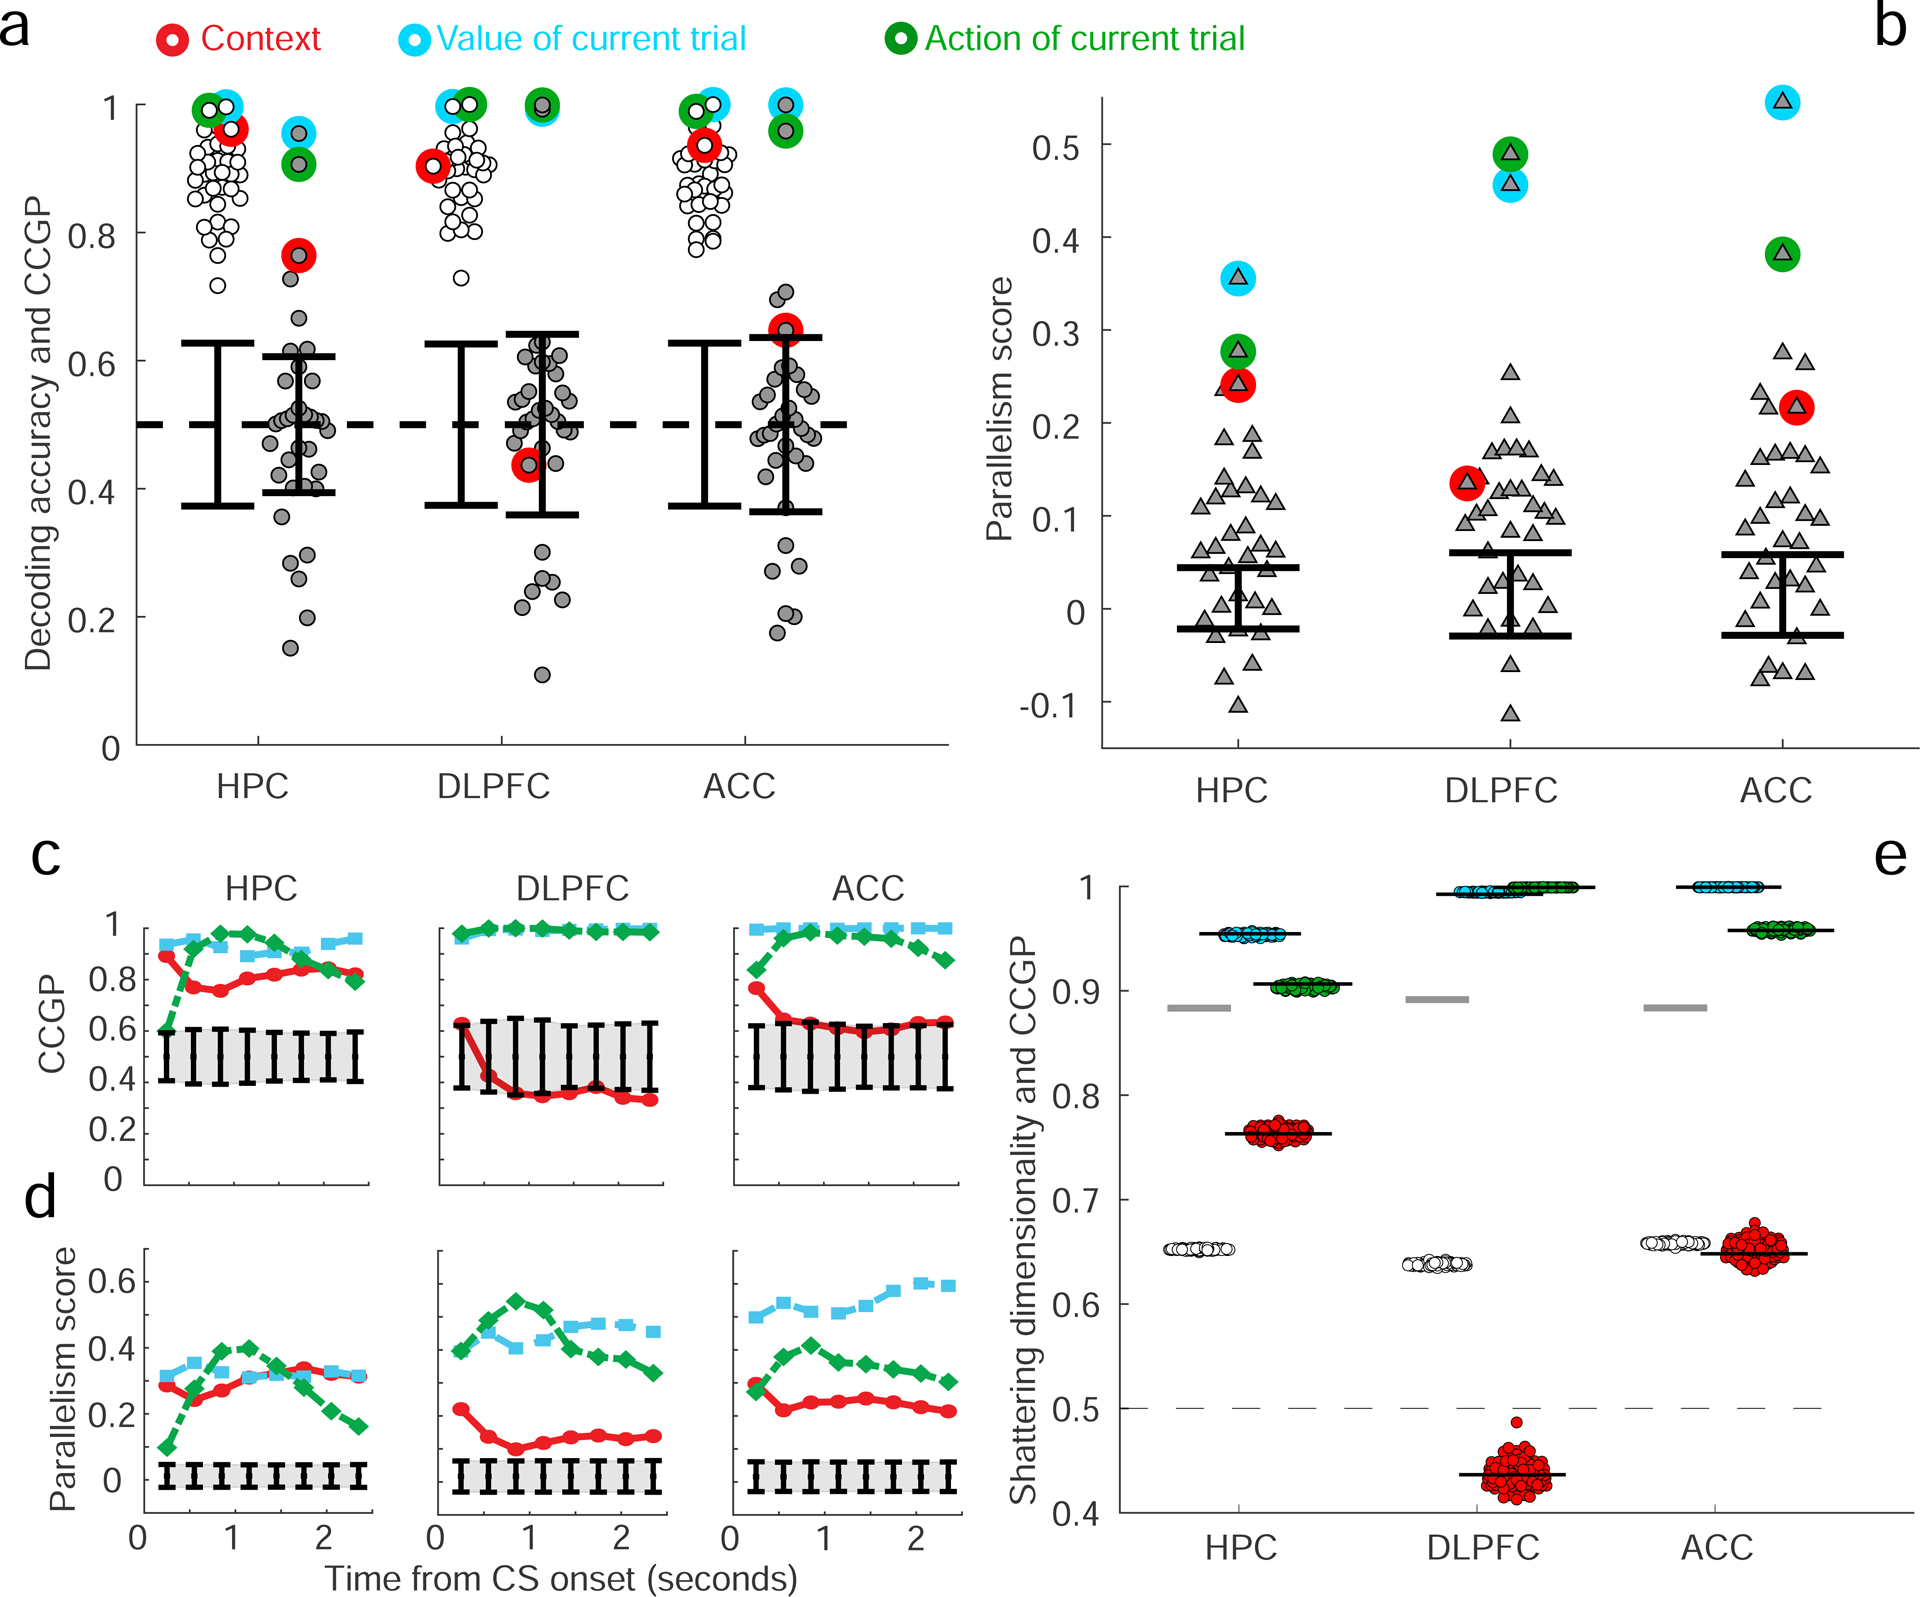
Figure 5: Decoding accuracy, CCGP and the PS after stimulus onset in the 3 brain areas.

a,b. CCGP, decoding accuracy and PS for all 35 dichotomies in the time interval from 100ms to 1000ms after stimulus onset. See Table T2 for the values of CCGP and PS for all dichotomies. Error bars, ± 2 standard deviations around chance as obtained from a geometric random model (CCGP) or from a shuffle of the data (decoding accuracy and PS). The SD is higher in this interval than in the earlier time epoch: HPC 0.88, DLPFC 0.89 and ACC 0.88. Results were qualitatively similar in the two monkeys (see Figs. S5). C-d. CCGP (c) and the PS (d) plotted as a function of time for the variables context, action and value in the 3 brain areas (900 ms window beginning 100 ms after stimulus onset, 300 ms steps). e. The SD observed in each brain area is significantly greater than the SD of a perfectly factorized representation. Same analysis as in Figure 3e but for this later time interval.
