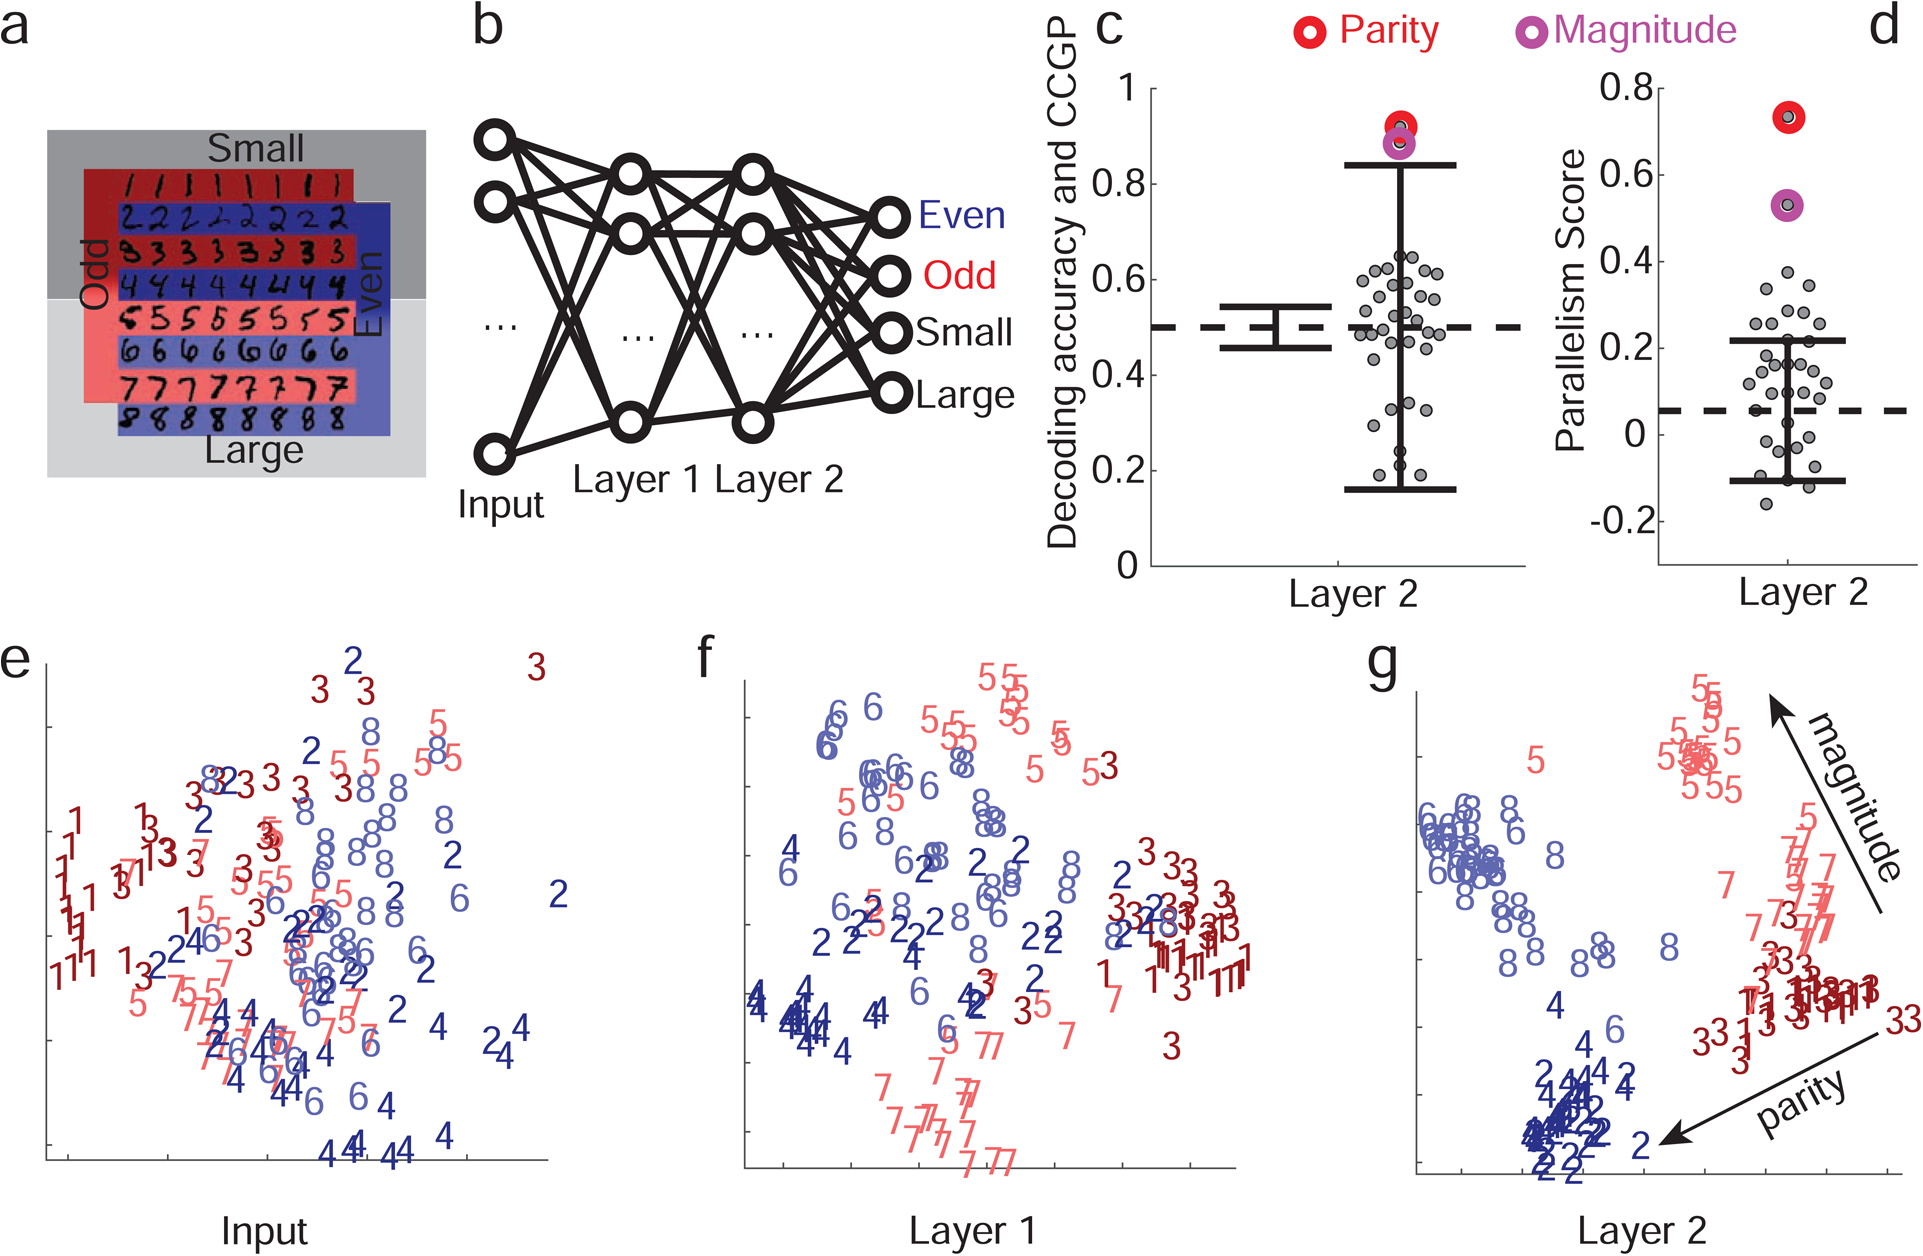
Figure 7: Simulations of a multi-layer neural network replicate experimentally observed geometry.

a. Schematic of the two discrimination tasks using the MNIST dataset and color code for panels e,f,g. The colors indicate parity, and shading indicates the magnitude of the digits (darker for smaller ones). b. Diagram of the network architecture. The input layer receives images of MNIST handwritten digits 1–8. The two hidden layers have 100 units each, and in the final layer there are 2 pairs of output units corresponding to 2 binary variables. The network is trained using back-propagation to simultaneously classify inputs according to whether they depict even/odd and large/small digits. c. CCGP and decoding accuracy for variables corresponding to all 35 balanced dichotomies when the second hidden layer is read out. Only the 2 dichotomies corresponding to parity and magnitude are significantly different from a geometric random model (chance level: 0.5; the two solid black lines indicate ±2standard deviations). Decoding performance is high for all dichotomies, and hence inadequate to identify the variables stored in an abstract format. d. Same as b, but for the PS, with error bars (±2 standard deviations) obtained from a shuffle of the data. Both CCGP and the PS allow us to identify the output variables used to train the network. e-g. Two-dimensional MDS plots of the representations of a subset of images in the input (pixel) space (e), as well as in the first (f) and second hidden layers (g). In the input layer there is no structure apart from the accidental similarities between the pixel images of certain digits (e.g. ones and sevens). In the first, and even more so in the second, layer, a clear separation between digits of different parities and magnitudes emerges in a geometry with consistent and approximately orthogonal coding directions for the two variables. For neural network simulations of the task performed by the monkeys, See Methods S1 Simulations of the parity/magnitude task: dependence on hyperparameters for more details. See also Methods S8 Deep neural network models of task performance, Figure S7 for a reinforcement learning model, and Figure S8 for a supervised learning model.
