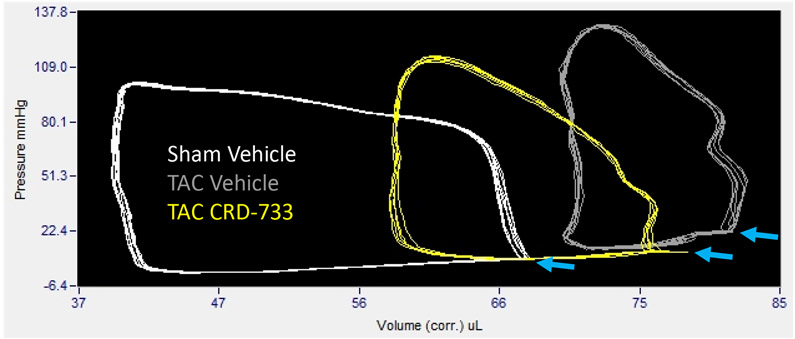
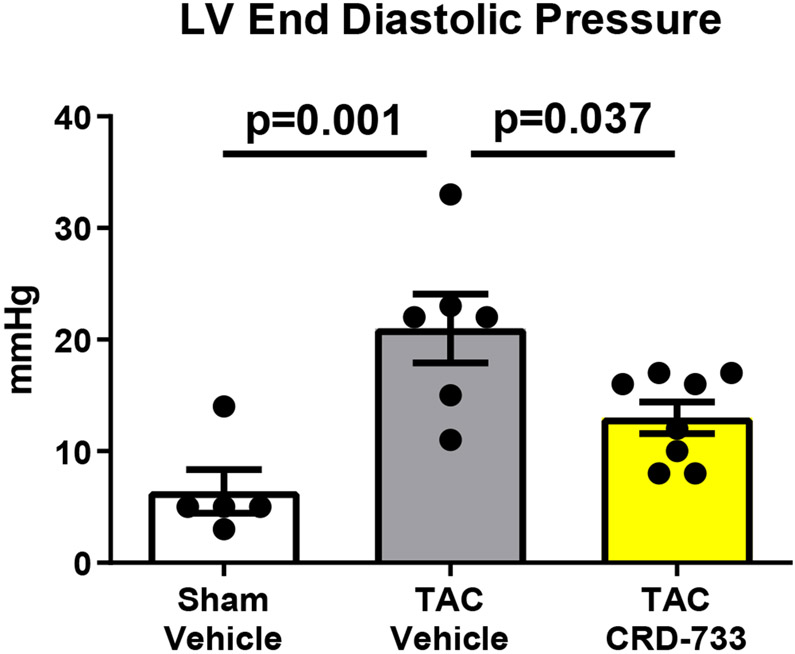
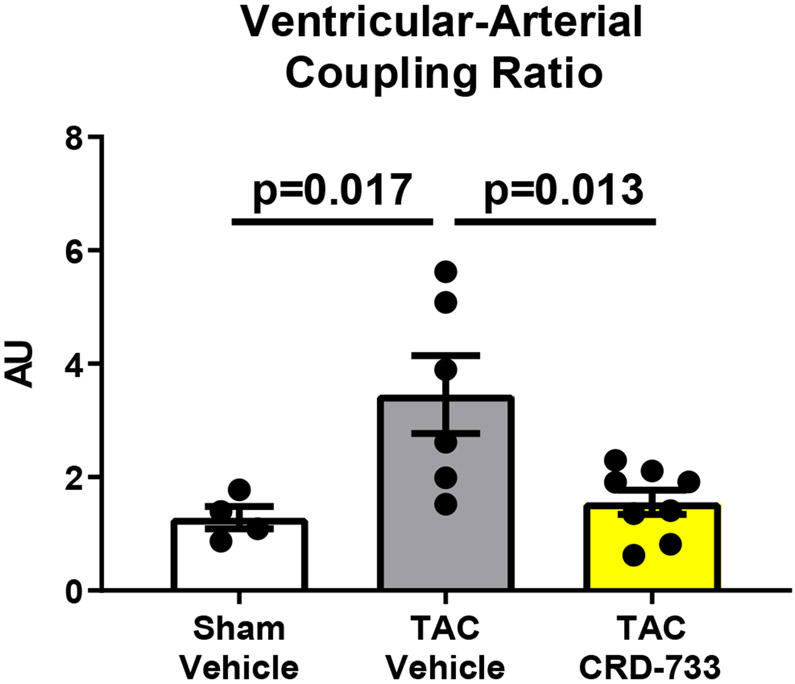
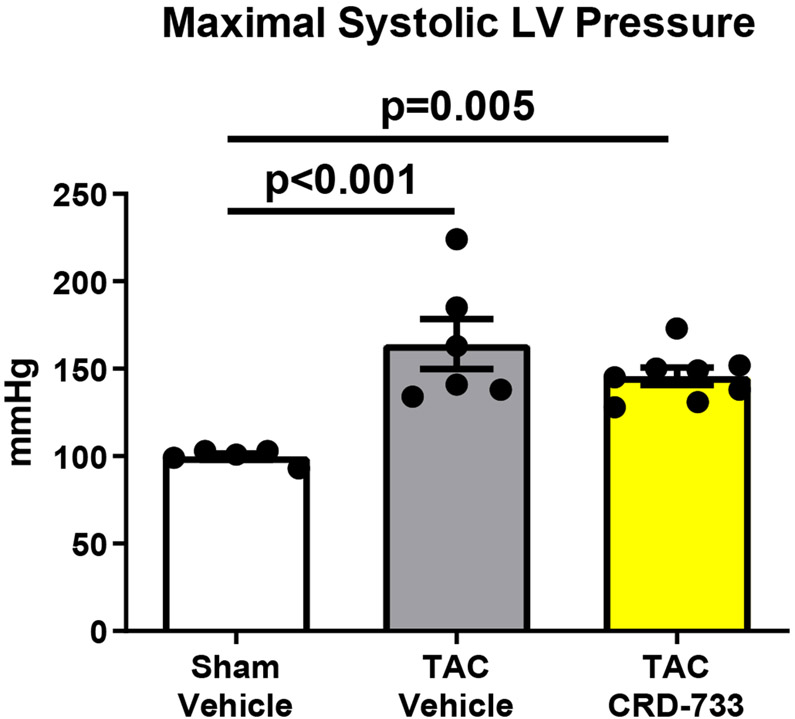
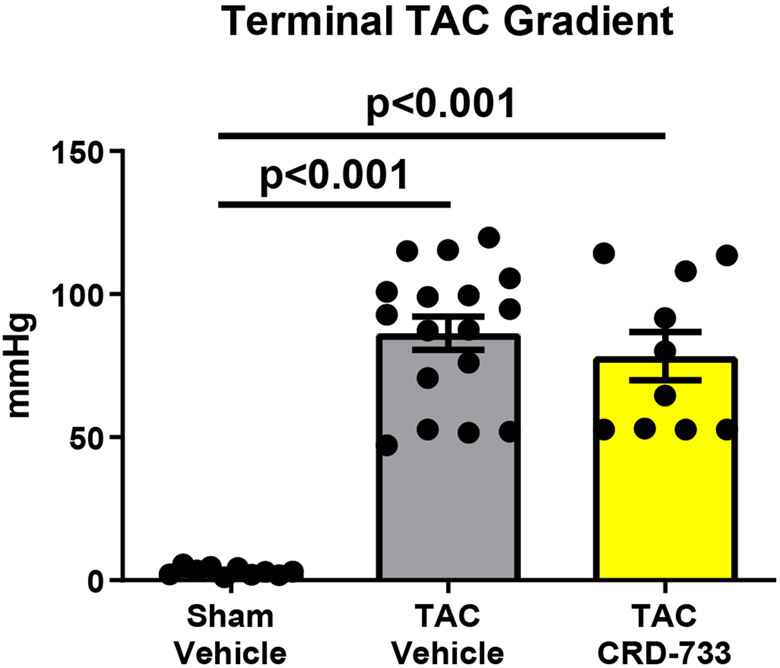
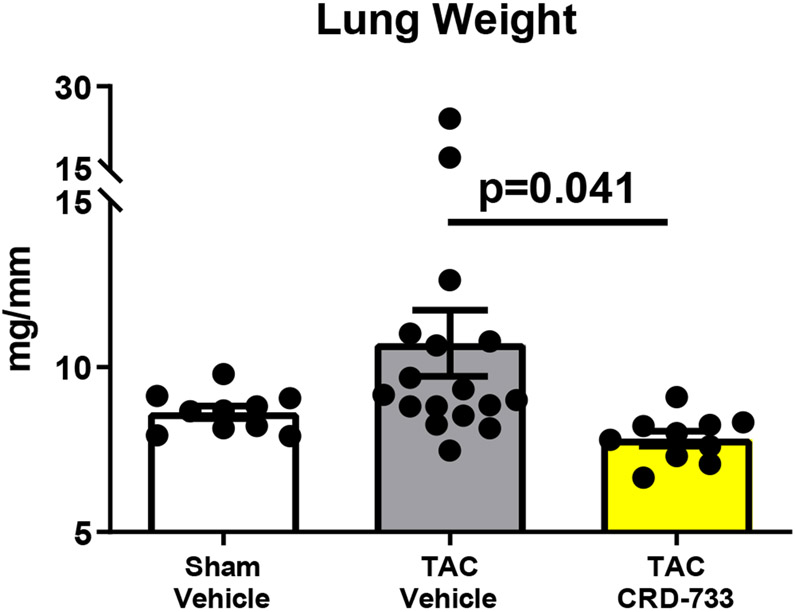
Figure 5. CRD-733 reverses TAC-induced elevations in left ventricular (LV) end diastolic pressure and lung weight, despite sustained maximal LV pressure and TAC gradients.
A, Representative pressure-volume loops showing end diastolic volumes denoted by blue arrows. B, LV end diastolic pressure C, Ventricular-arterial coupling ratio and D, Maximal LV pressure obtained by invasive hemodynamics. E, Echocardiography-derived peak trans-TAC gradient after treatment. F, Normalized terminal lung weights after 21 days of TAC and 14 days of treatment. Results are expressed as mean ± SEM. Comparisons were performed using 1-way ANOVA with Tukey’s post-test; n=5-8 (B-D) and n=10-17 (E-F).

