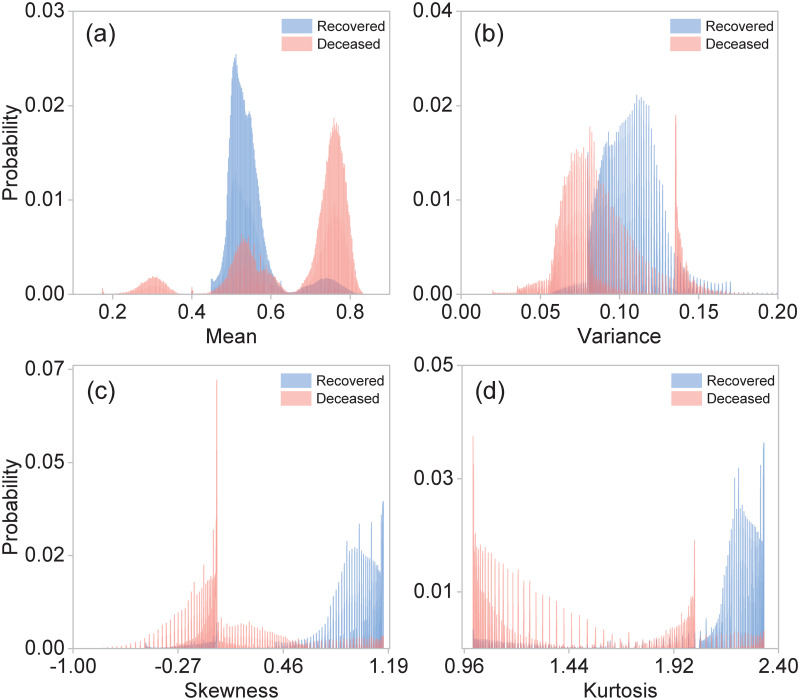
Fig 5. Normalized statistical distributions for different central moments: (a) Mean, (b) Variance, (c) Skewness, and (d) Kurtosis, for class 1 (recovered) shown in blue, and for class 2 (deceased) shown in red.
These central moments were computed for a subset of 4 characteristics (age, hospitalization status, intubation and ICU). The distributions were computed from the whole dataset with 4, 700, 464 observations.

