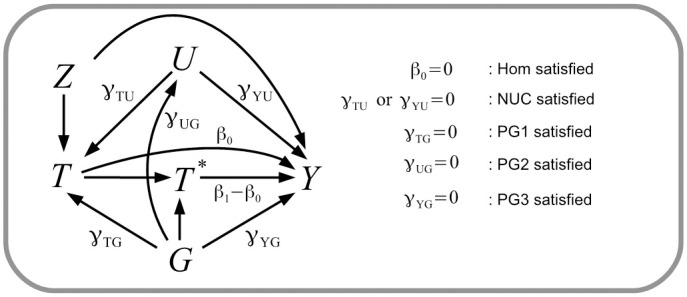
Fig 2. Causal diagram explaining the key assumptions leveraged by the methods proposed.

The diagram and notation are consistent with outcome model (2) and the simulation simulation study. Here and throughout the paper, the variable Z represents measured confounders of T and Y and U represents unmeasured confounders.
