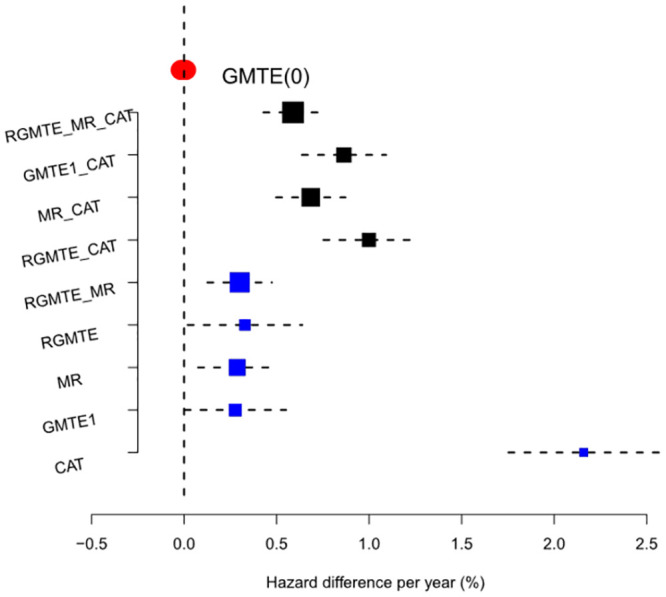
Fig 7. Forest plot of results for the Clopidogrel data.

Blue squares show individual causal estimates as well as combined estimators that pass the heterogeneity test at the 5% level. Black squares show combined estimates that fail the heterogeneity test at the 5% level. Red bar shows the point estimate and confidence interval for the GMTE(0) estimate.
