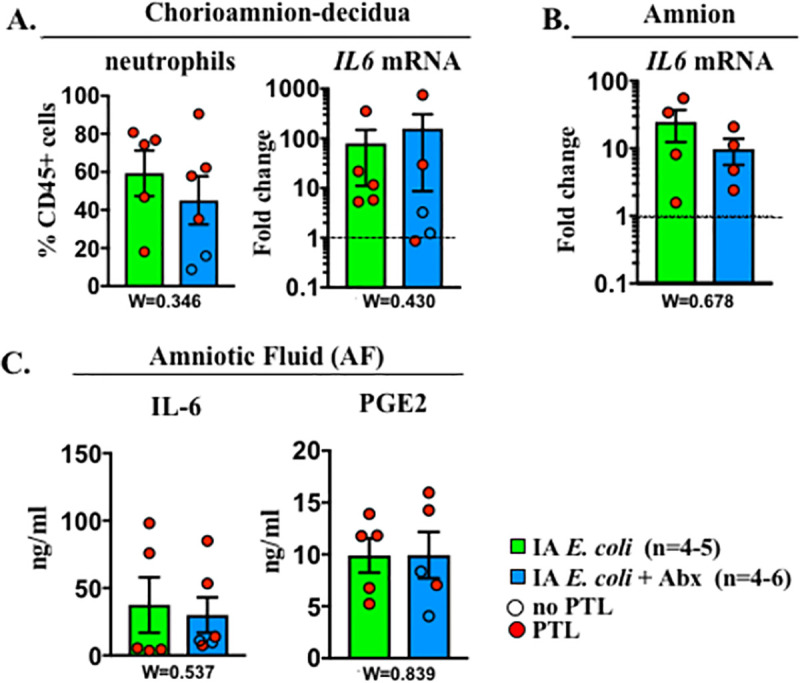
Fig 4. Abx treatment did not decrease E. coli–induced inflammation.

The comparison groups are IA E. coli without Abx (green bar) and IA E. coli with Abx (blue bar). Red circles denote animals with PTL, while clear circles denote animals without PTL. Values were expressed as fold change value for the IA saline control group. Comparison of (A) chorio-amnion decidua neutrophil frequency and IL6 mRNA, (B) amnion IL6 mRNA, and (C) AF IL6 and PGE2. Dashed line represents the mean value of ctrl animals. Data are mean, SEM. Wilcoxon test (W) comparing the 2 groups was applied, and p-values are shown under each panel. See S1 Data for numerical values. Abx, antibiotics; AF, amniotic fluid; IA, intra-amniotic; IL-6, interleukin 6; PGE2, prostaglandin E2; PTL, preterm labor.
