
Fig 3. HNRNPL binds to hemidesmosome and cell-substrate assembly genes.
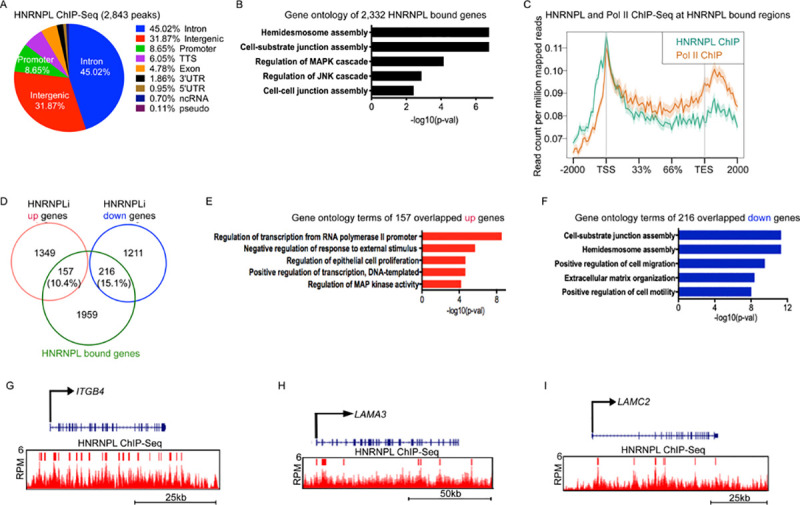
(A) Genomic localization of the 2,843 HNRNPL bound peaks. The percent of HNRNPL binding to each genomic region is shown. HNRNPL ChIP-Seq was performed in primary human keratinocytes in growth conditions (n = 3 independent experiments). (B) GO terms of the 2,332 genes that the 2,843 HNRNPL bound peaks mapped to. (C) Metagene plot of HNRNPL (teal) and RNA Pol II (orange) ChIP-Seq reads at HNRNPL bound regions. Y-axis is shown as read count per million reads, and X-axis is the distance along HNRNPL bound genes. TSS is transcription start site, and TES is transcription end site. (D) Venn diagram of HNRNPL bound genes (HNRNPL ChIP-Seq) with genes up-regulated or down-regulated upon HNRNPL depletion. (E) GO terms of the HNRNPL bound genes that overlap with genes increased upon HNRNPL loss. (F) GO terms of the 216 decreased genes upon HNRNPL knockdown that overlap with HNRNPL bound genes. (G–I) Gene tracks of ITGB4 (G), LAMA3 (H), and LAMC2 (I). HNRNPL ChIP-Seq is shown in red. Y-axis shows RPM, and red bar over gene tracks represent significant peaks. X-axis shows position along gene. Primary data for this figure can be found in S1 Data. ChIP-Seq, chromatin immunoprecipitation sequencing; GO, gene ontology; HNRNPL, heterogeneous nuclear ribonucleoprotein L; Pol II, polymerase II; RPM, reads per million.