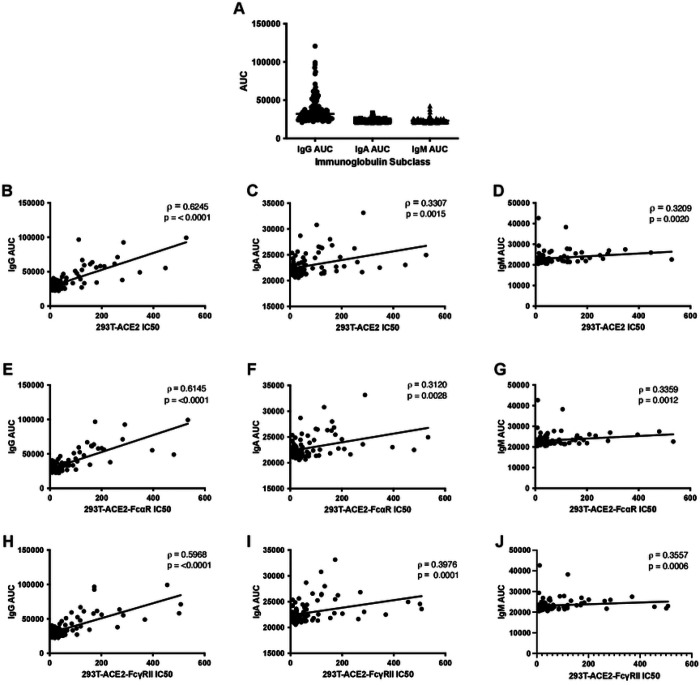
Figure 4. Correlations of anti-S titers with IC50 in cell lines expressing ACE2 and Fc receptors.
Neutralization titers of SARS-CoV-2 convalescent plasma or serum remain constant when titrated against cells with different Fc receptors. Differences between AUC of IgG, IgA, and IgM was analyzed using the Kruskal-Wallis test with horizontal lines representing median values (A). Half-maximal neutralizing titers (IC50) were compared against antibody titers calculated as area under the curve (AUC) from an anti-S ELISA that specifically quantifies anti-S IgG, IgA, or IgM antibodies. Correlation analysis of IgG (B,E,H), IgA (C,F,I), and IgM (D,G,J) ELISA AUC data vs. neutralization IC50 values for three stable cell lines expressing the human receptor ACE2 alone or in combination with FcαR or FcγRII, as indicated. Spearman correlation (ρ) values and absolute p-values (p) are indicated.

