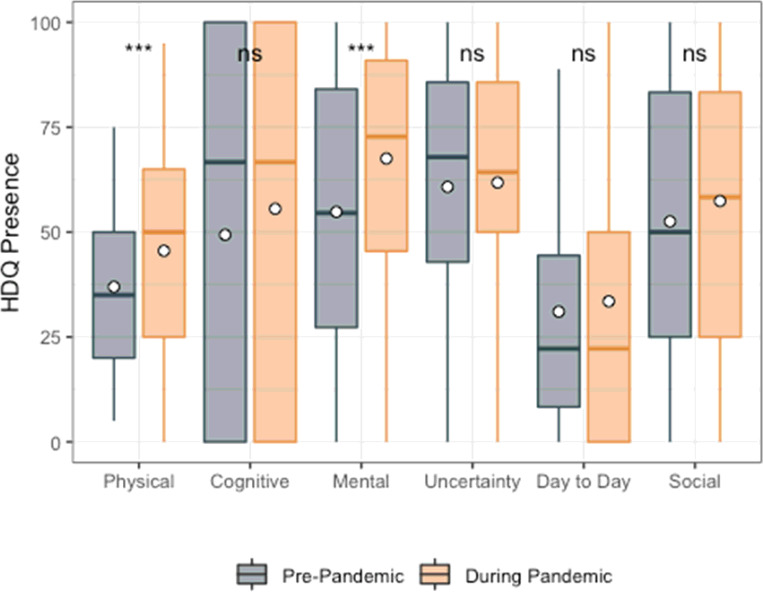
Figure 2.
HDQ Presence mean domain scores prior to and during the pandemic (n=51). Significance of paired t-tests is shown above each domain as follows: *** p<0.001, ** 0.001 < p ≤ 0.01, * 0.01< p ≤ 0.05 and ns indicates p>0.05. n=51 participants. Boxplots indicate median line and inter-quartile range (IQR), whiskers indicate 1.5 x IQR. Mean is shown as a circle.

