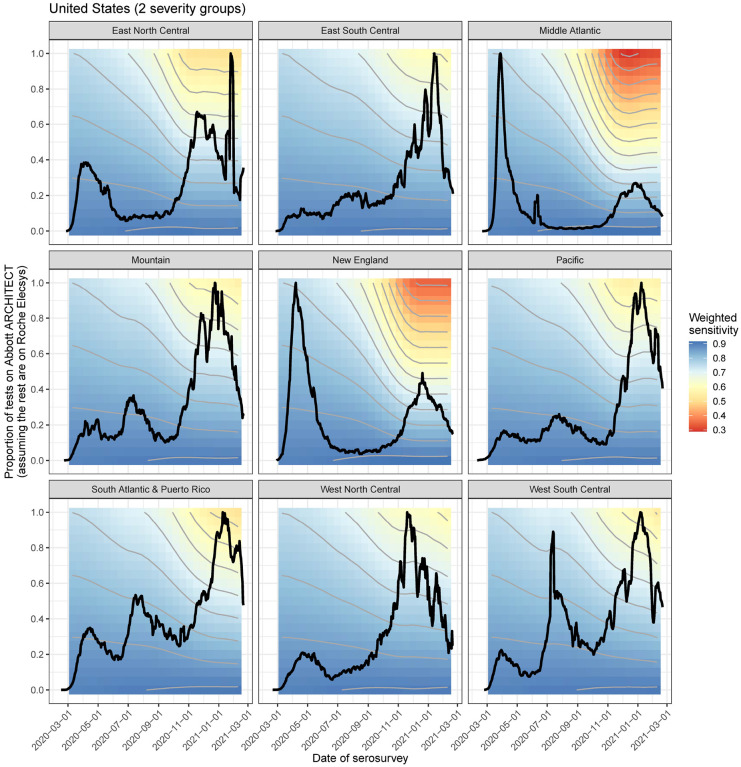
Figure 6: Weighted sensitivity by time and assays used for the US CDC Nationwide Commercial Laboratory Seroprevalence Survey.
Weighted assay sensitivity by census division in the United States as a function of (hypothetical) serosurvey dates between March 2020 and March 2021 (x-axis), and proportion of tests performed on the Abbott ARCHITECT assay (y-axis), incorporating symptom onset curves (black line) and demography at the census division level. This is using the 2 severity group scenario. This assumes that the rest of the tests were performed on the Roche Elecys assay, on which antibody responses remain robust over time. Contour interval of 0.05.

