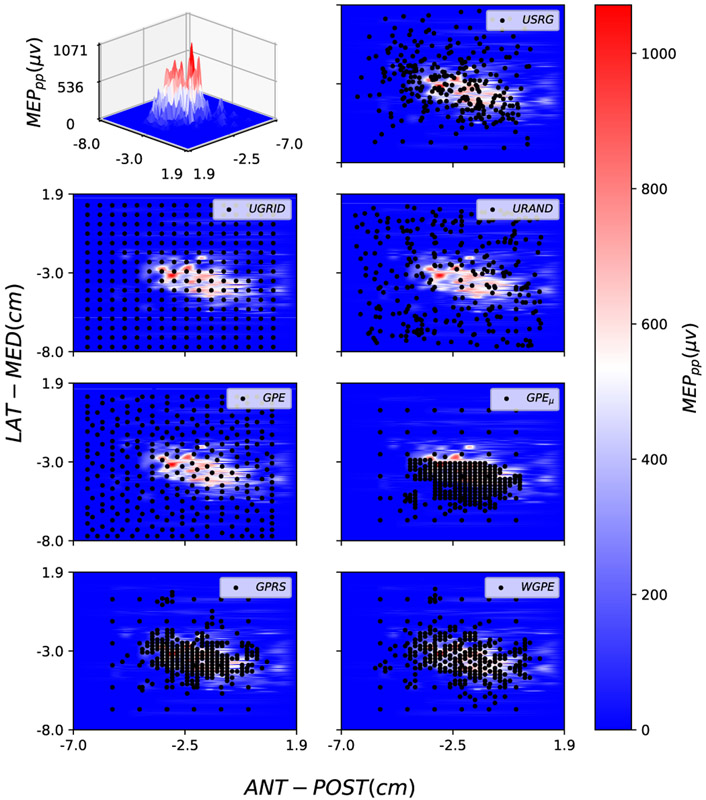
Fig. 3.
Using Warped GP model, a surface is fitted on the real TMS data to create a representation of MEP map for subject 3. This map can be viewed in either a 3D (top left) or 2D (others) map. The color bar represents the MEPpp and Black circles indicate the selected stimulation loci by each method (specified in top right of each subplot).

