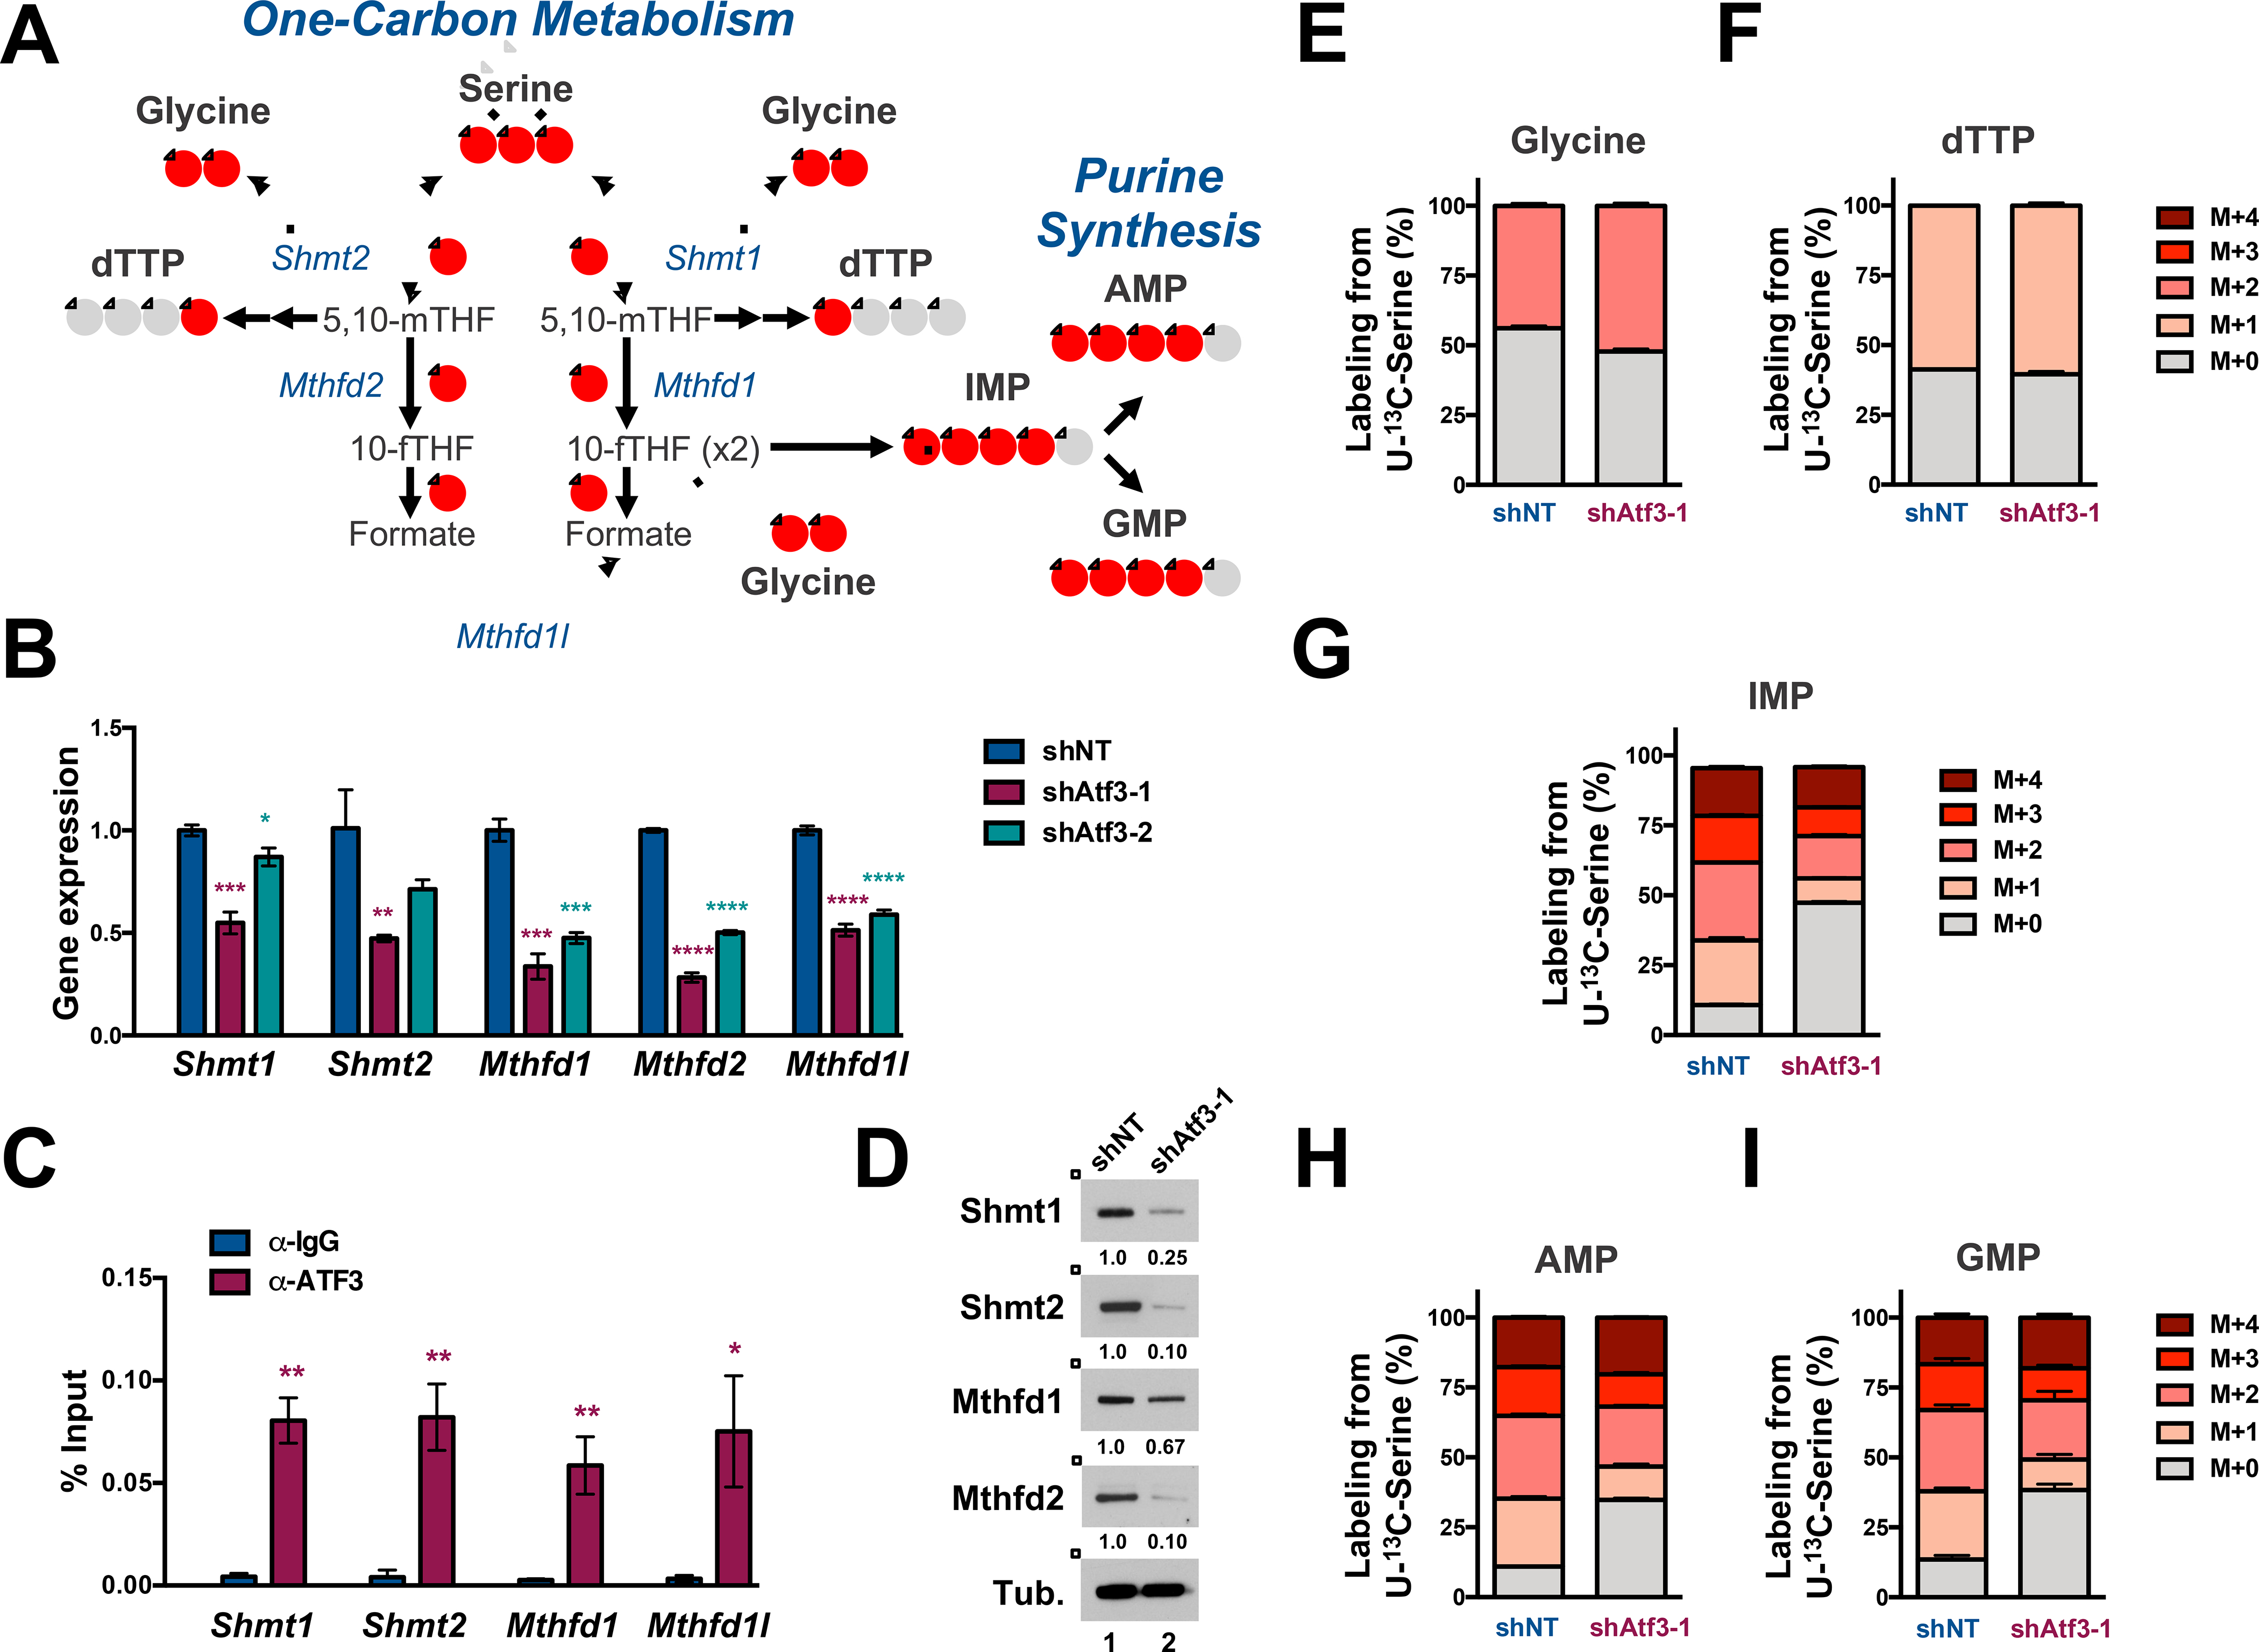
Figure 6. ATF3 inhibition abrogates serine-derived purine synthesis.

(A) Schematic of one-carbon (1C) metabolism that feed into purine synthesis. Red circles represent 13C atoms derived from U-13C-Serine. (B) qPCR analysis of indicated 1C metabolism mRNAs in shNT-, shAtf3–1- and shAtf3–2-expressing MLL-AF9 cells. (C) qPCR quantification of Atf3 binding at the indicated promoters by anti-IgG and -ATF3 ChIP analysis in MLL-AF9. The approximate promoter regions are: Shmt1 (+500 – 1500); Shmt2 (0 - +1000); Mthfd1 (−500 - +500); Mthfd1l (0 - +1000). Data are presented as the % of input. (D) Western blot analysis of GFP+ MLL-AF9 cells expressing shNT or shAtf3–1 at 3 days post-transduction with the indicated antibodies. Quantified proteins levels were normalized to tubulin. (E-I) shNT or shAtf3–1-expressing MLL-AF9 at 48 hours post-transduction were cultured for 24 hours with U-13C-serine and metabolites were subsequently extracted and analyzed by HILIC-MS. Isotopologue distribution (%) of the total steady-state levels of: (E) Glycine, (F) dTTP, (G) IMP and (H) AMP and (I) GMP. All graphed data represents the mean ± SD of three technical replicates. Asterisk key = *P ≤ 0.05; **P ≤ 0.01; ***P ≤ 0.001; ****P ≤ 0.0001. See also Figure S5.
