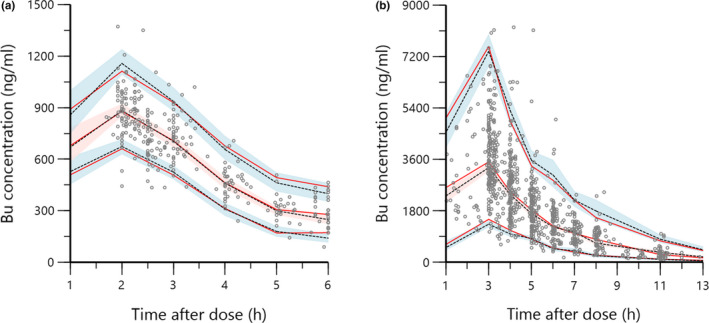
FIGURE 2.

Prediction‐corrected visual predictive check of the final model using the external validation data set: (a) doses every 6 h and (b) doses every 24 h. The marks represent the observed concentrations. Red solid lines represent the 5th, 50th, and 95th percentiles of observed concentrations; dashed black lines represent the 5th, 50th, and 95th percentiles of predicted concentrations; and shaded areas represent 95% confidence intervals of the predicted 5th, 50th, and 95th percentiles. The observed data's percentiles were in concordance with the predicted data's percentiles. Bu, busulfan
