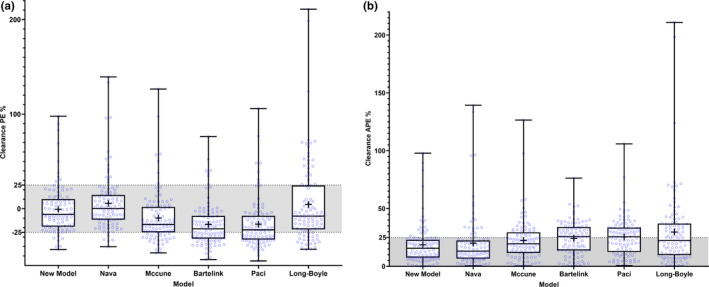
FIGURE 3.

(a) Accuracy and (b) precision of the model‐predicted first‐dose clearances obtained with the new glutathione‐s‐transferase A1‐based and fludarabine‐based models and other tested models. The shaded area represents the acceptance interval in terms of bias and precision. The central lines in the boxplots represent the median values. The plus signs represent the mean values. The bottom and top edges of the boxplots indicate the 25th and 75th percentiles of predicted clearance errors. The whiskers represent the full range of prediction errors. The new model exhibits better accuracy (mean prediction error closer to 0) than every model except for the Long‐Boyle model (see Table 3). The new model exhibits better precision (lowest mean absolute prediction error, error distribution within the 25% acceptance limit) than every model except for the Nava model. APE, absolute prediction error; PE, prediction error
