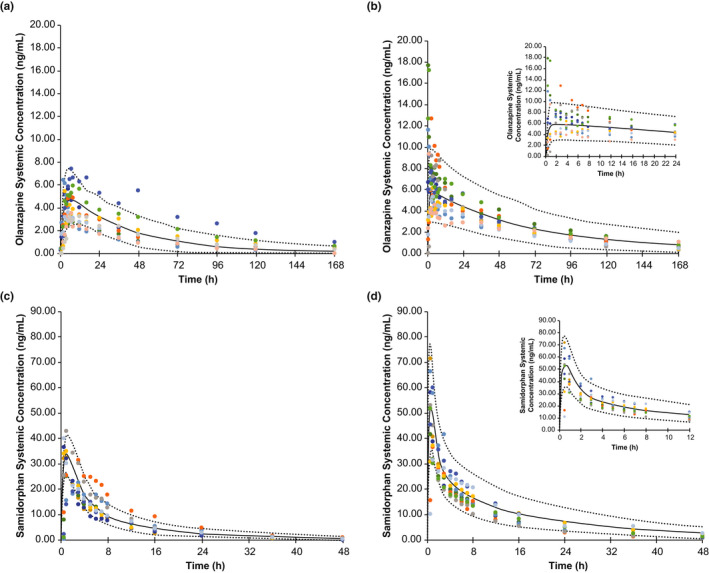
FIGURE 3.

Model validation: observed and simulated concentrations of olanzapine in (a) healthy controls and (b) subjects with moderate hepatic impairment, and of samidorphan in (c) healthy controls and (d) subjects with moderate hepatic impairment, following a single dose of OLZ/SAM 5 mg/10 mg. The solid line represents the mean data for the simulated population (n = 100), and the dashed lines are the 5th and 95th percentiles of the population. Observed data (n = 1012) are presented as symbols; each subject is indicated by a distinct color. The insets in (b) and (d) depict early time points in greater detail. OLZ/SAM, combination of olanzapine and samidorphan
