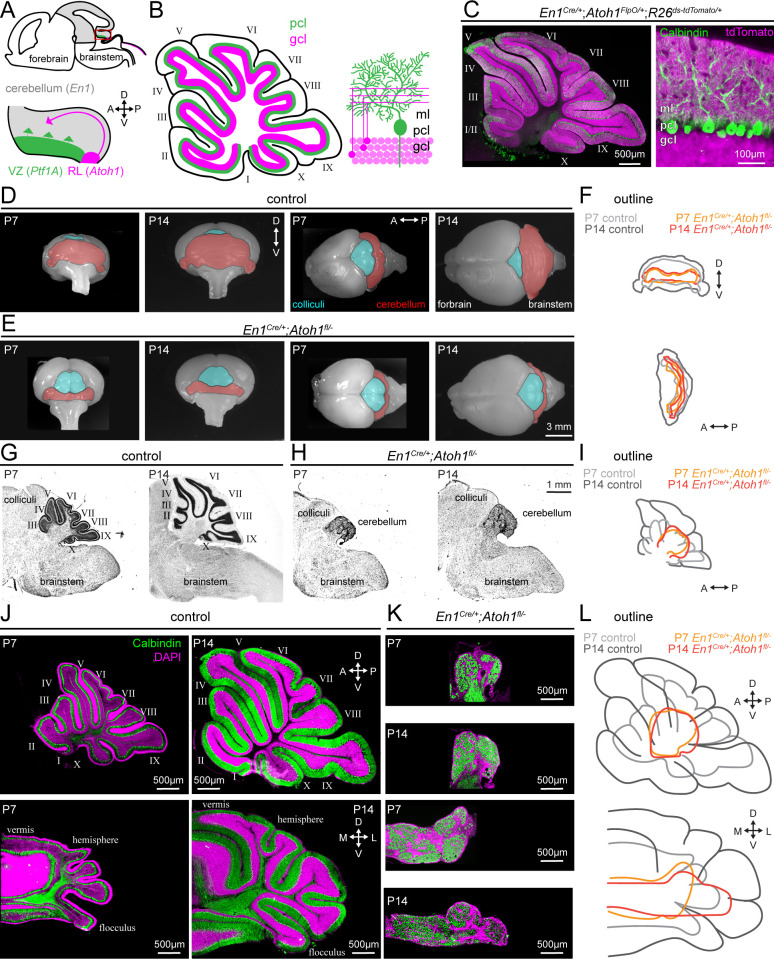
Figure 1. Conditional deletion of Atoh1 from the En1 domain prevents proper size expansion, lamination, and foliation of the cerebellum.
(A) Schematic of an embryonic brain. Inset is the cerebellar anlage. Atoh1 domain (excitatory lineage neurons, including granule cell precursors, pink), Ptf1a domain (inhibitory lineage neurons, including Purkinje cell precursors, green), En1 domain (gray). Orientation is the same for all panels unless otherwise indicated. (B) Schematic of a sagittal section of a P14 cerebellum (left). Cerebellar lobules are labeled with Roman numerals (Larsell, 1952). Schematic of the cerebellar microcircuit with Purkinje cells and granule cells (right). Purkinje cell = green; granule cell = pink; ml = molecular layer, pcl = Purkinje cell layer; gcl = granule cell layer. (C) Intersectional labeling of En1;Atoh1 domain with tdTomato (pink) shows no overlap with Purkinje cells (Calbindin; green). (D) Whole brain images of cerebellum from anterior (left two images) and dorsal view (right two images) from P7 and P14 in control animals. The cerebellum is pseudo-colored in red. (E) Whole brain images of the cerebellum from anterior (left two images) and dorsal views (right two images) from P7 and P14 En1Cre/+;Atoh1fl/- mice. The cerebellum is pseudo-colored in red. (F) Outline of cerebellar size in control and En1Cre/+;Atoh1fl/- mice at P7 and P14 showing size expansion in control, but not En1Cre/+;Atoh1fl/- mice. (G) Sagittal sections of the hindbrain from control mice stained with cresyl violet to visualize gross architecture and regional organization of the brain. (H) Sagittal sections of the hindbrain from En1Cre/+;Atoh1fl/- mice stained with cresyl violet showing the general deformities in regional patterning. (I) Outline of cerebellar size in control and En1Cre/+;Atoh1fl/- mice at P7 and P14 showing size expansion in control, but not En1Cre/+;Atoh1fl/- mice. (J) Sagittal (top) and coronal (bottom) whole section images of cerebella from P7 (left) and P14 (right) control mice. Purkinje cells are stained with Calbindin (green) and DAPI (pink). Note the layered and foliated structure of the cerebellum. (K) Sagittal (top) and coronal (bottom) whole section images of cerebella from P7 and P14 En1Cre/+;Atoh1fl/- mice. Purkinje cells are stained with Calbindin (green) and DAPI (pink). All images are presented at the same magnification. Note the lack of layers and foliation. All images in J and K are presented at the same magnification. (L) Outline of cerebellar size in control and En1Cre/+;Atoh1fl/- mice at P7 and P14 showing size expansion in control, but not in the En1Cre/+;Atoh1fl/- mice. All images are representative of N=3 per age and genotype group.

