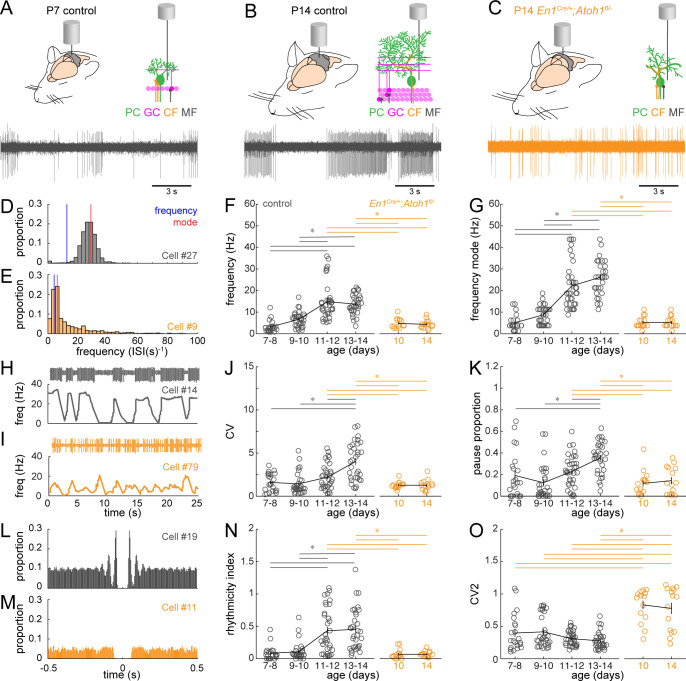
Figure 5. Purkinje cell simple spike firing patterns transform from P7 to P14 in control mice and reflect altered maturation in P14 En1Cre/+;Atoh1fl/- mice.
(A) Schematic of in vivo Purkinje cell recordings in P7 control mouse. Top left: cerebellum with recording electrode. Top right: schematic with recording electrode extracellular to Purkinje cell body. Bottom: representative 15 s recording from a Purkinje cell, each large vertical line is an action potential. (B) Same as (A) For P14 control mouse. (C) Same as (A) for P14 En1Cre/+;Atoh1fl/- mouse. (D) and (E) Examples of frequency (interspike interval, ISI−1) distributions of simple spike firing rate in a P14 Purkinje cell recorded in a control (D) and En1Cre/+;Atoh1fl/- (E) mouse. Blue line indicates the ‘frequency’ as calculate by the total number of simple spikes/recording time (spikes/s). Red lines indicate ‘frequency mode’ as the frequency most commonly observed in the frequency distribution. (F) Simple spike firing frequency (spikes/recording time). (G) Simple spike frequency mode (peak ISI−1 distribution). (H) and (I) example recordings (25 s) from P14 Purkinje cells in control (H) and En1Cre/+;Atoh1fl/- (I) mouse. The top is the recording. Bottom is the firing frequency averaged over one second. (J) Simple spike CV (global firing irregularity). (K) Pause percentage (proportion of recording with ISI > five times average ISI). (L) and (M) Examples of auto-correlograms of the simple spike ISI in a P14 Purkinje cell recorded in a control (L) and En1Cre/+;Atoh1fl/- (M) mouse. (N) Simple spike rhythmicity index calculated based on auto-correlogram. (O) Simple spike CV2 (local firing irregularity). For F,G, J, K, N, and O, significance was determined using an ANOVA between the four control age groups and two En1Cre/+;Atoh1fl/- age groups followed by a Tukey-Kramer post-hoc analysis to assess differences between the groups. Significance was accepted at p<0.05. In the figure, the statistical significance between two groups is indicated as a line starting and ending above the two groups. Gray lines indicate differences within control groups of different ages and orange lines indicate differences between control and En1Cre/+;Atoh1fl/- groups. N/n-numbers: control: P7-8: n=22 cells from N=13 mice; control P9-10: n=30/N=12; control P11-12: n=35/N=11; control P13-14: n=32/N=14; En1Cre/+;Atoh1fl/- P10: n=15/N=3; En1Cre/+;Atoh1fl/- P14: n=15/N=6. The raw data and specific p-values for all the comparisons are presented in Figure 5—source data 1.
Figure 5—figure supplement 1. Simple spike distributions of single Purkinje cells.


