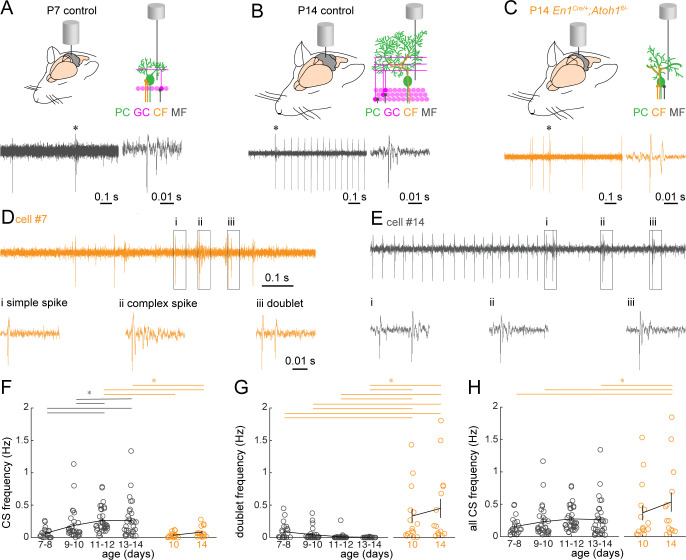
Figure 8. Purkinje cell complex spike firing patterns change from P7 to P14 in control mice and are altered in P14 En1Cre/+;Atoh1fl/- mice.
(A) Schematic of in vivo Purkinje cell recordings in P7 control mouse. Top left: cerebellum with recording electrode. Top right: schematic showing the recording electrode extracellular and adjacent to the Purkinje cell body. Bottom right: representative 1 s recording from Purkinje cell, each large vertical line is an action potential. *indicates a doublet/complex spike. Bottom left: doublet indicated on the right. (B) Same as (A) For P14 control mouse. * = a complex spike. (C) Same as (A) for P14 En1Cre/+;Atoh1fl/- mouse, * is a doublet. (D) Example of a Purkinje cell recording with a classical complex spike and doublet occurring in the same cell (trace is 1 s long). Bottom are expanded views of (i) simple spike, (ii) complex spike, and (iii) doublet in top trace. The trace is an example from a Purkinje cell recording in a P14 En1Cre/+;Atoh1fl/- mouse. (E) Example of a Purkinje cell recording with a train of classical complex spikes (trace is 1 s long). Bottom are expanded views for the three complex spikes occurring in rapid succession of one another (i, ii, iii). (F) Frequency of ‘classical’ complex spikes. (G) Frequency of doublets. (H) Frequency of combined complex spikes and doublets. For F-H, significance was determined using an ANOVA between the four control age groups and two En1Cre/+;Atoh1fl/- age groups followed by a Tukey-Kramer post-hoc analysis to assess differences between the groups. Significance was accepted at p<0.05. In the figure, the statistical significance between two groups is indicated as a line starting and ending above the two groups. Gray lines indicate differences within control groups of different ages and orange lines indicate differences between control and En1Cre/+;Atoh1fl/- groups. N/n-numbers: control P7-8: n=22 cells from N=12 mice; control P9-10: n=30/N=12; control P11-12: n=35/N=11; control P13-14: n=32/N=14; En1Cre/+;Atoh1fl/- P10: n=15/N=3; En1Cre/+;Atoh1fl/- P14: n=15/N=6. The raw data and specific p-values for all the comparisons are presented in Figure 8—source data 1.

