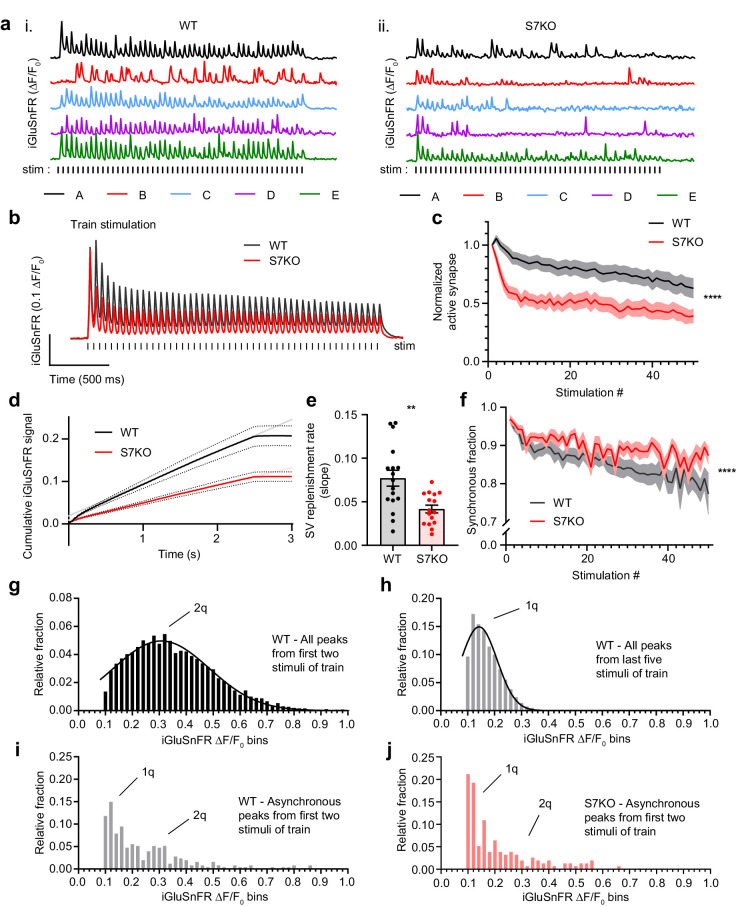
Figure 2. SYT7 counteracts depression and promotes asynchronous release during sustained stimulation.
(a) Representative traces of iGluSnFR ΔF/F0 signals (single regions of interest (ROIs) A-E), from one full field of view (FOV) during high-frequency stimulation (HFS) of wild-type (WT) (i) and SYT7KO (ii) neuronal preparations. Samples were field stimulated with a frequency of 20 Hz for 2.5 s (50 action potentials (APs)). (b) Average iGluSnFR ΔF/F0 traces during high-frequency stimulation (HFS) for WT (black, n = 17) and SYT7KO (red, n = 16), from three independent experiments (same source data for b–f). (c) Fraction of active synapses, defined as synapses releasing peak glutamate above baseline, >4 SD above noise, as a function of stimulation number during HFS. Values are means (lines) +/- SEM (lighter shade error), ****p<0.0001 by two-way analysis of variance (ANOVA) comparing genotypes. (d) Plot of the average cumulative iGluSnFR ΔF/F0 signal from WT (black) and SYT7KO (red) neurons vs time. Dotted lines represent SEM and gray (WT) and light red (SYT7KO) linear lines represent linear fits to the last 1.5 s of the train. (e) Synaptic vesicle (SV) replenishment rates were calculated from slopes of linear regressions from individual traces used in panel (d). Values are means +/- SEM, WT (0.077 +/- 0.009) and SYT7KO (0.042 +/- 0.004); **p = 0.0019 using unpaired two-tailed t-test. (f) Fraction of synchronous release, defined as peak iGluSnFR ΔF/F0 within 10 ms of each stimulus from the total interstimulus interval, as a function of stimulation number during HFS. Values are means (bold lines) +/- SEM (lighter shade fill); ****p<0.0001 by two-way ANOVA comparing genotypes. (g) Quantal analysis using all detected iGluSnFR peaks (n>6000) from the first two stimuli of a 20 Hz train from WT neurons binned into 0.02 ΔF/F0. (h) Quantal analysis using all detected iGluSnFR peaks (n>10,000) from the last five stimuli of a 2.5-s 20 Hz train from WT neurons. (i) Quantal analysis using asynchronous iGluSnFR peaks (n = 254) from the first two stimuli of a train from WT neurons. (j) Quantal analysis using asynchronous iGluSnFR peaks (n = 156) from the first two stimuli of a train from S7KO neurons (asynchronous is defined as iGluSnFR peaks that occur more than 10 ms after a stimulus, but before the proceeding stimulus). Gaussian distributions were generated with no restrictions in panels (g) and (h). In panels (i) and (j), 1q and 2q labels were added based on the mean values from panels (g) and (h). From panel (g), mean (2q) = 0.31 [95% CI 0.30–0.32] and from panel (h), mean (1q) = 0.14 [95% CI 0.14–0.15]. WT asynchronous vs S7KO asynchronous distributions in panels (i) and (j) are different by Kolmogorov-Smirnov test; approximate p-value = 0.005 with K-S D = 0.1760.
Figure 2—figure supplement 1. Extended analyis of HFS experiments.


