
Figure 1.
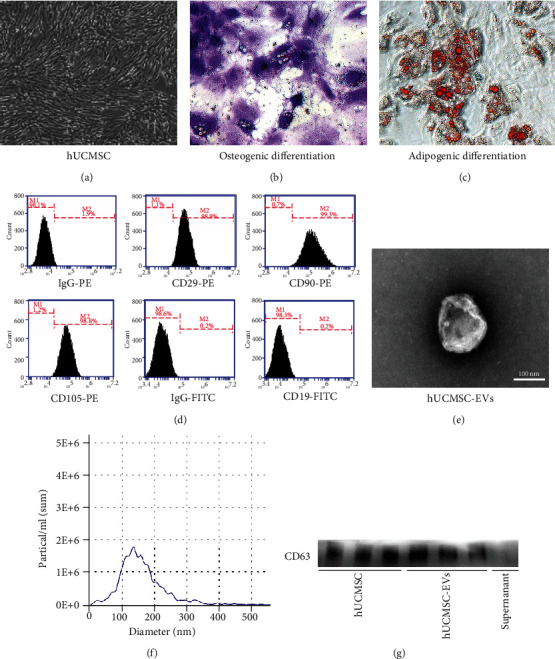
Characterization of hUCMSCs and hUCMSC-EVs. (a) Morphology of passage 3 hUCMSCs under white light microscope, magnification: ×40. (b, c) Induction of osteogenic (alkaline phosphatase stained) and adipogenic differentiation (Oil Red O stained) of hUCMSCs, magnification: ×200. (d) Phenotypic markers related to hUCMSCs by flow cytometry analysis. (e) Representative images of hUCMSC-EVs using a transmission electron microscope (TEM), scale bar: 100 nm. (f) The particle size distribution and concentration of hUCMSC-EVs by nanoparticle tracking analysis (NTA). (g) Western blot analysis of CD63 expression in hUCMSC-EVs and hUCMSCs. Supernatant obtained during EV isolation by ultracentrifugation was regarded as negative control.