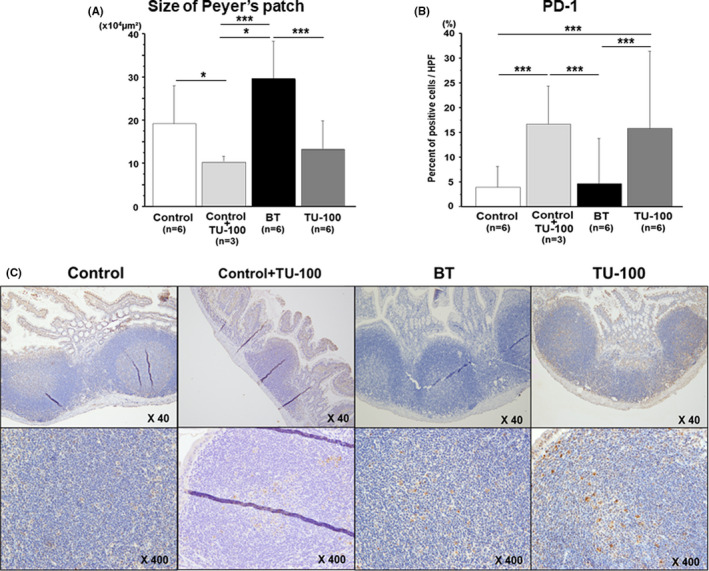
FIGURE 2.

The Peyer's patch size and PD‐1 expression. (A) The Peyer's patch size was significantly greater in the bacterial translocation (BT) group than the control group (P < .05), but the size improved in the TU‐100 group (P < .05). (B) The PD‐1 expression in Peyer's patches in the TU‐100‐treated group was increased compared to that in the control and the BT groups (P < .05). PD‐1 expression was significantly increased by administration of TU‐100 only (P < .05). (C) Representative immunohistochemistry of PD‐1 expression in Peyer's patches. *P < .05, **P< .01, ***P< .001
