
Fig. 4.
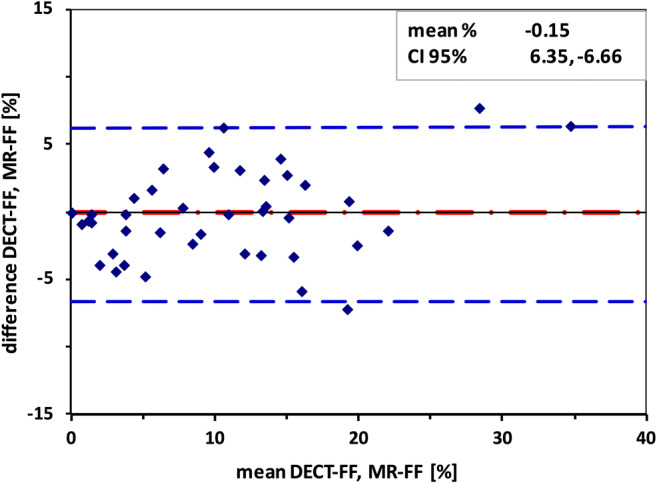
Bland-Altman plot of DECT-FF and MR-FF. Mean difference between dual-energy computed tomography fat fraction (DECT-FF) and magnetic resonance chemical shift relaxometry fat fraction (MR-FF) was −0.15%. 95% confidence interval (95% CI) was approximately 6.5%. The highest difference of 7.74% was found for the patient with the highest fat fraction within the study population (38% in DECT and 32% in MR, within the right posterior paraspinal muscles)