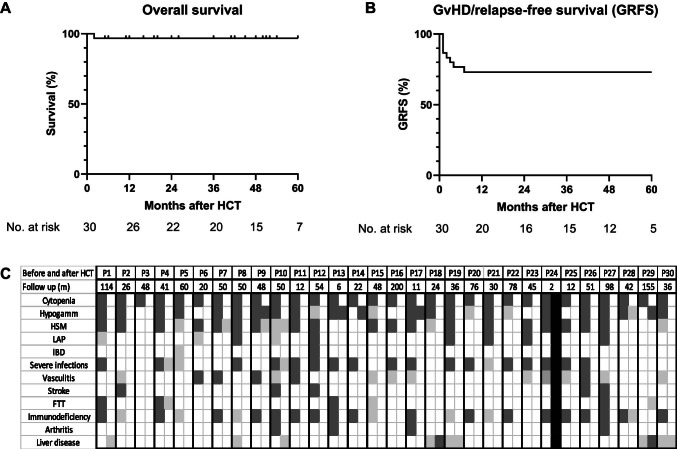
Fig. 1.
Kaplan–Meier curves representing A overall survival, B GvHD-free, relapse-free survival (GRFS). GvHD relapse-free survival was calculated as the time from first HCT until the first occurrence of any of the following events: grades 3–4 aGvHD or moderate/severe cGvHD GF, disease relapse (poor graft function/graft failure with DADA2 disease relapse requiring repeat transplant), or death. Overall survival is calculated on total number of patients (n = 30); GRFS is calculated on total number of HCT procedures, excluding the two procedures performed with stem cells from an affected sibling (n = 34). C Effect of HCT on clinical features resolution. Black squares indicate death post-HCT. Dark gray squares represent the presence of a clinical feature/phenotype. Light gray squares represent major improvement in clinical features. White squares represent complete resolution of clinical features. Each patient is presented by 2 attached columns (before and after HCT) for comparison. Follow-up time post-HCT for each patient is shown in months (second row). Severe infections represent any viral, bacterial, or fungal infection that required antiviral or antifungal treatment or led to sepsis. FTT, failure to thrive; HSM, hepatosplenomegaly; LAP, lymphadenopathy

