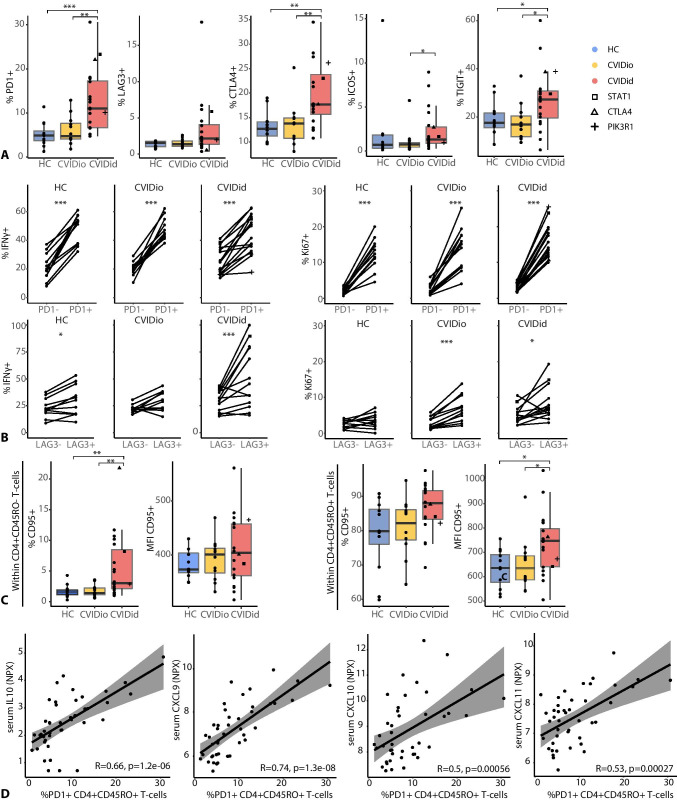
Fig. 3.
Negative regulators of immune activation in CVID. A Proportions of PD1, LAG3, CTLA4, ICOS, and TIGIT in CD4 + CD45RO + T-cells. B Percentage and median fluorescence intensity of CD95 (FAS-L) in naïve (CD45RO −) and effector-memory (CD45RO +) CD4 + T-cells. C Comparison of IFNγ + and Ki67 + cells in PD1- and LAG3-positive and negative populations. Only samples with > 50 events in the PD1/LAG3-positive and PD1/LAG3-negative populations were included. D Spearman correlation between PD1 and IL10, CXCL9, CXCL10, or CXCL11. CVIDid = CVID with immune dysregulation (n = 20), CVIDio = CVID with infections only (n = 12), HC = healthy controls (n = 12). Statistics (A&C): Mann–Whitney U-test. Statistics B: paired Wilcoxon-Rank test. *p < 0.05, **p < 0.01, ***p < 0.001

