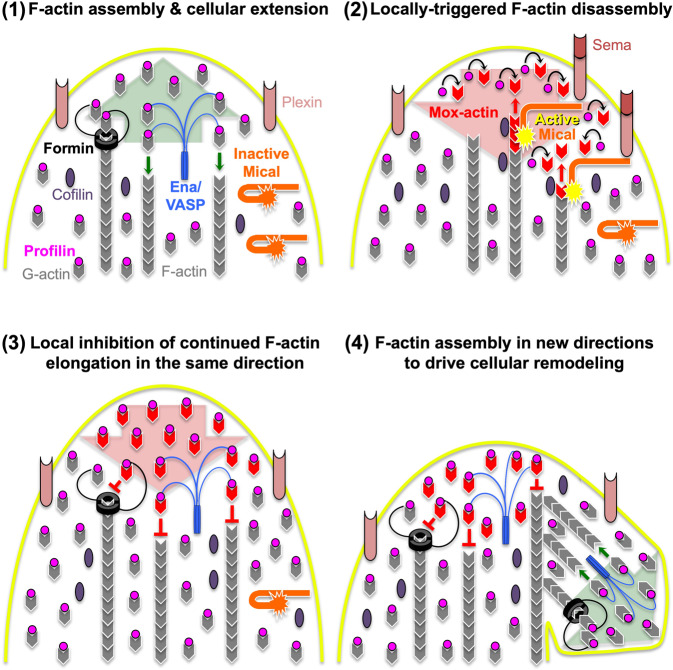
Fig. 7. Model of profilin and Mical combining to impair continued F-actin assembly and enhance disassembly and remodeling.
Our in vitro and in vivo observations, coupled with previous results (e.g., refs. 9,10,12,14,32–35,40), suggest the following working model (depicted in a chronological sequence (1–4)): (1) In the absence of Mical activation, profilin binds G-actin and—through its ability to assist in formin and Ena/VASP-driven barbed-end actin polymerization (small green arrows)—acts as a positive effector of actin assembly and cell elongation (large green arrow). (2) Mical, in contrast, works in response to negative effectors of cell movement, such as Semaphorin repellents and their Plexin receptors—which locally activate Mical to oxidize and promote F-actin disassembly (small red arrows), which negatively affects cell elongation (large red arrow). This creates a local pool of Mical-oxidized actin (Mox-actin (red)). (2–3) At this spatiotemporal point, Mical and profilin’s effects become intertwined to exert a new effect on cytoskeletal and cellular behavior. Namely, Mox-actin (generated in (2)) exerts a secondary effect: by binding to profilin ((2), curved black arrows) and inhibiting profilin’s positive effects on formin and Ena/VASP-driven continued actin elongation ((3), red inhibitory symbols). These Mox-actin–profilin complexes thereby locally inhibit actin elongators in areas where Mical gets activated, stalling continued elongation and cellular growth in the same direction. Additionally, profilin, through its ability to interact with Mox-F-actin, enhances Mox-F-actin disassembly. Thus, these combined effects of Mical and profilin give rise to local subpopulations of disassembled F-actin and paused/slow growing barbed ends ((3), large red arrow). (4) Since profilin is ubiquitously localized, it also binds to unmodified actin, which is located outside of regions where Mical is actively disrupting actin filaments/elongation. Profilin, then, supplies this unmodified actin to relieve Mox-actin-induced inhibition of actin elongation-promoting factors, assisting in new branch formation/cellular remodeling by inducing actin polymerization (e.g., small green arrows) and elongation in new directions (large green arrow). For simplicity/to aid in visualization, formins and Ena/VASP’s association with the cell membrane (yellow) is not illustrated. Similarly, some molecular components are not illustrated in each panel of (1–4). Diagram modified from ref. 36.

