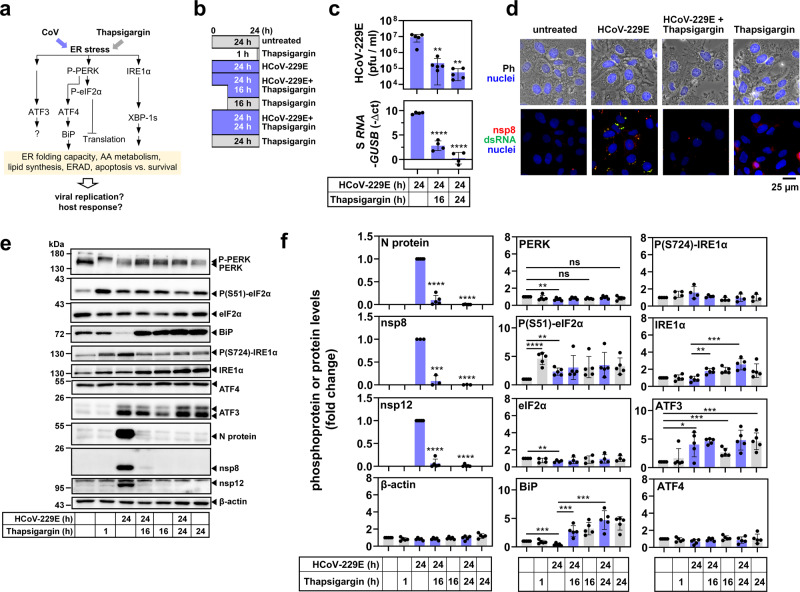
Fig. 2. Thapsigargin inhibits HCoV-229E replication and counteracts virus-mediated BiP downregulation.
a Schematic overview of parameters used to monitor virus- and thapsigargin-mediated ER stress. b Schematic presentation of HCoV-229E infection of cells and/or treatment with thapsigargin as applied in this study. c HuH7 cells were left untreated or infected with HCoV-229E (MOI = 1) for 24 h and treated with thapsigargin (1 µM) according to the scheme shown in (b). Supernatants and RNA isolated from the cell pellets were used to determine viral titers by virus plaque assay and expression of HCoV-229E S gene-encoding RNA (five (upper graphs) or four (lower graphs) biologically independent experiments). d Phase-contrast (Ph) and fluorescence microscopy images showing the morphology of HuH7 cells and the subcellular HCoV-229E replication sites (at 24 h p.i.) identified by nsp8- and double-strand RNA-specific antibodies in the presence or absence of thapsigargin (1 µM for 24 h) (representative images from one out of two biologically independent experiments). Nuclei were stained with Hoechst 33342. e Representative immunoblots of total cell extracts from HuH7 cells infected with HCoV-229E (MOI = 1) and treated with thapsigargin (1 µM) according to (b) showing the expression/modification of the indicated host cell and viral proteins. f Quantification of immunoblot data as shown in (e) relative to the untreated control (three or more biologically independent experiments). All bar graphs show means ± s.d.; asterisks indicate p values (*p ≤ 0.05, **p ≤ 0.01, ***p ≤ 0.001, ****p ≤ 0.0001) obtained by two-tailed unpaired t-tests.

