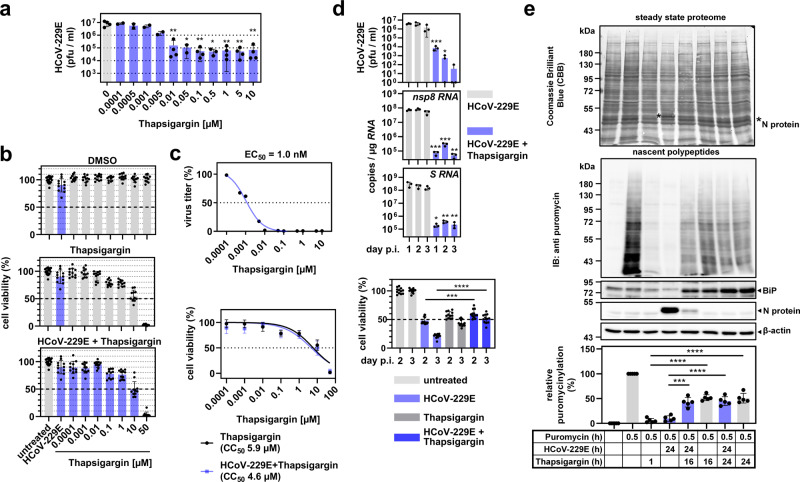
Fig. 3. Thapsigargin mediates dose-dependent, long-lasting inhibition of HCoV-229E replication and leads to partially improved survival and protein biosynthesis of infected cells.
a Dose-dependent suppression of HCoV-229E replication in the absence or presence of increasing concentrations of thapsigargin. At 24 h p.i., viral titers of cell culture supernatants were determined (two or more biologically independent experiments). b HuH7 cells were left untreated, or were infected with HCoV-229E (MOI = 1) in the presence/absence of increasing concentrations of thapsigargin or DMSO as solvent control. After 24 h, cell viability was assessed by MTS assay (five biologically independent experiments). c All data from (a) and (b) were used to compute the relative estimated half-maximal effective (EC50) (upper graph, means of two or more biologically independent experiments) and cytotoxic (CC50) (lower graph, means ± s.d. of five biologically independent experiments) concentrations of thapsigargin in HuH7 cells infected with HCoV-229E. d HuH7 cells were infected with HCoV-229E (MOI = 1) and treated with a single dose of thapsigargin (1 µM) as indicated. Viral titers, copy numbers of viral RNAs (detected using nsp8 coding sequence- and S gene-specific primers, respectively), and cell viabilities were determined after 1−3 days (three biologically independent experiments). e HuH7 cells were treated and infected according to Fig. 2b. Thirty minutes before harvesting, puromycin (3 µM) was added where indicated. Total cell extracts were analyzed by immunoblotting. The blot membrane was stained with CBB to assess the steady-state proteomes and then hybridized with anti-puromycin antibodies to detect de novo synthesized nascent polypeptides. Puromycin signals of each lane were normalized to the corresponding CBB staining and were background corrected by subtracting signals of samples in which puromycin had been omitted. The upper graphs show representative images and the lower graph shows the quantification of five biologically independent experiments. All bar graphs show means ± s.d.; asterisks indicate p values (*p ≤ 0.05, **p ≤ 0.01, ***p ≤ 0.001, ****p ≤ 0.0001) obtained by two-tailed unpaired t-tests. See Supplementary Fig. 2 for PERK inhibitor data.

