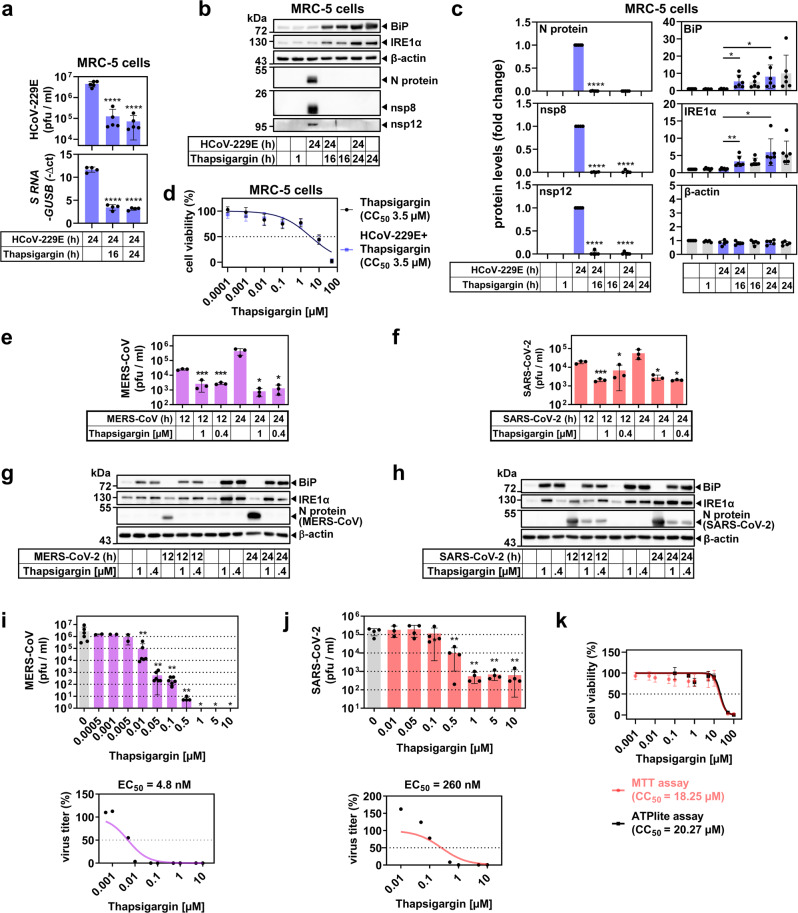
Fig. 4. Thapsigargin inhibits the replication of high- and low-pathogenic human coronaviruses in multiple cell types.
a–d Human embryonic MRC-5 lung fibroblasts were infected with HCoV-229E according to the scheme shown in Fig. 2b. a Viral titers (upper graph, five biologically independent experiments) and expression of viral S gene-encoding RNAs (lower graph, four biologically independent experiments). b, c Expression of viral and host cell proteins. b Shows one representative immunoblot of total cell extracts and c shows quantification from four or more biologically independent experiments. d Cell viability was analyzed and quantified as described in the legend of Fig. 3 (four biologically independent experiments). e–j Similarly, HuH7 cells or Vero E6 African green monkey kidney epithelial cells were infected with MERS-CoV (MOI = 0.5) or SARS-CoV-2 (MOI = 0.5) for 12 h or 24 h in the presence/absence of 0.4 µM or 1 µM thapsigargin. e, f Show viral titers and g, h display representative images of the corresponding expression of MERS-CoV/SARS-CoV-2 nucleocapsid (N) and host cell proteins, respectively (three biologically independent experiments). i Dose-dependent suppression of MERS-CoV-2 replication by thapsigargin in HuH7 cells infected with an MOI of 0.5 (upper graph, two or more biologically independent experiments) and the estimated EC50 concentration calculated from the mean values (lower graph). j Dose-dependent suppression of SARS-CoV-2 replication by thapsigargin in Vero E6 cells infected with an MOI of 0.5 (upper graph, three or more biologically independent experiments) and the estimated EC50 concentration from the mean values (lower graph). k The CC50 of thapsigargin in Vero E6 cells was calculated by MTT or ATPlite assays as described in the legend of Fig. 3b, c. Data are from three or more biologically independent experiments. All bar graphs show means ± s.d.; asterisks indicate p values (*p ≤ 0.05, **p ≤ 0.01, ***p ≤ 0.001, ****p ≤ 0.0001) obtained by two-tailed unpaired t-tests (a, c, e, f, j) or ordinary one-way ANOVA (i). See Supplementary Figs. 3–5 for quantifications from replicates for MERS-CoV/SARS-CoV-2 immunoblot experiments and for further inhibitor data.

