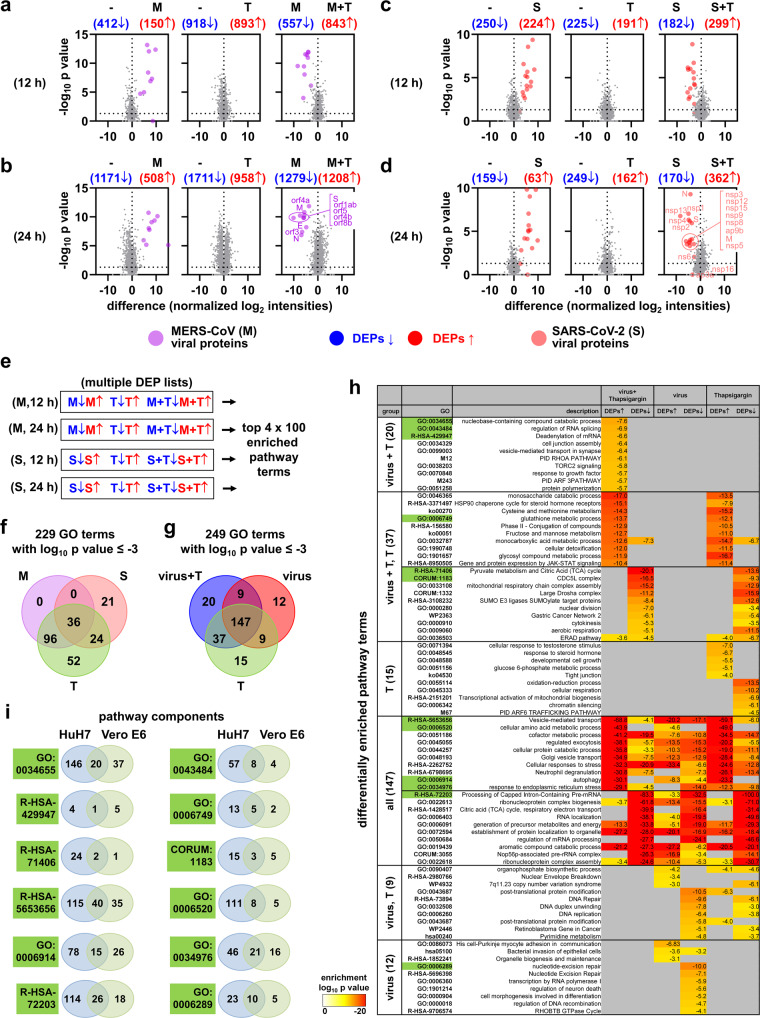
Fig. 6. Proteome-wide identification of thapsigargin action on MERS-CoV- or SARS-CoV-2-infected cells reveals virus- and thapsigargin-specific protein and pathway patterns.
Total cell extracts from uninfected cells (−), HuH7 cells infected with MERS-CoV (M, MOI = 3) for 12 h (a) or 24 h (b), or Vero E6 cells infected with SARS-CoV-2 (S, MOI = 3) for 12 h (c) or 24 h (d), in the presence or absence of thapsigargin (T, 1 µM) were subjected to LC-MS/MS analysis. 5,367 (from HuH7) or 5,066 (from Vero E6 cells) majority protein IDs were identified and their intensities were normalized between samples. Volcano plots show pairwise ratio comparisons and corresponding p values obtained from Student’s t-tests, which were derived from the means of two independent experiments for each condition and three technical replicates per sample. Blue and red colors indicate differentially expressed proteins (DEPs, ratio > 0, p value of −log10 (p) ≥ 1.3). Purple and light red colors indicate individual viral proteins. e Majority IDs (for HuH7 cells) or NCBI gene IDs (for Vero E6 cells) corresponding to the DEPs shown in (a)−(d)) were used for overrepresentation analyses to identify the top 100 enriched pathway categories per virus and time point using Metascape software44. Complete lists of pathways are shown in Supplementary Figs. 6 and 7 as clustered heatmaps. The top five enriched pathway categories for up- or downregulated DEPs are shown in Supplementary Fig. 8a. (f, g) The 400 enriched pathway categories were pooled and filtered for common and distinct pathways considering only terms with enrichment p values of log10 (p) ≤ −3. f Venn diagram showing pathway terms specific to MERS-CoV (M), SARS-CoV-2 (S), or thapsigargin (T). The top 20 enriched pathway categories are shown in Supplementary Fig. 8b. g Venn diagram showing pathway terms specific for the virus, thapsigargin, or infection plus thapsigargin (virus + T) conditions. h The heatmap shows the top differentially enriched pathways corresponding to the Venn diagram shown in (g). Green colors refer to the pathways highlighted in (i). i Twelve examples of differential and joint gene ID compositions of pathways enriched in HuH7 or Vero E6 cells.

