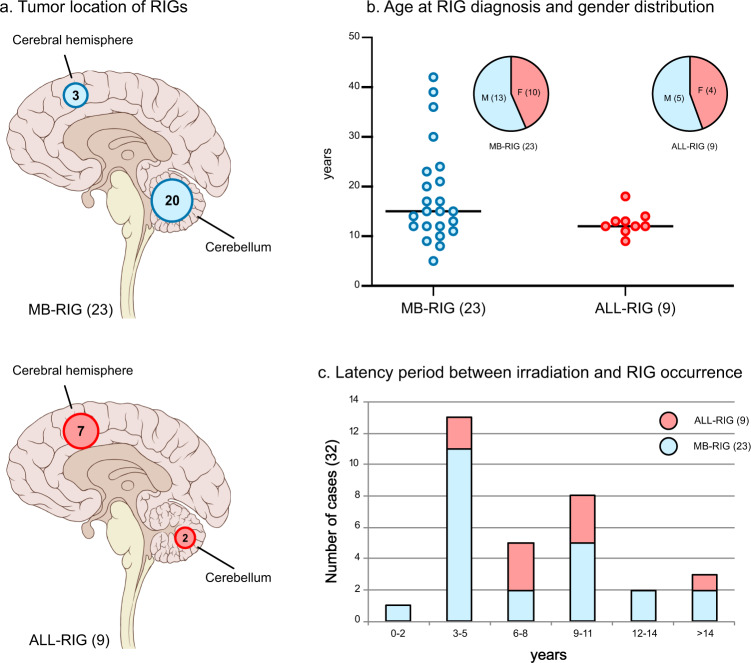
Fig. 1. Clinical patient characteristics.
Tumor location for 23 MB-RIG and 9 ALL-RIG illustrated with circled numbers indicating the number of patients with RIG occurrence in the respective brain region (a). Significant differences in tumor location were observed between MB-RIG and ALL-RIG patients (p < 0.01). Gender distributions, age at RIG diagnosis (b) and latency period (c) between cranial irradiation and RIG diagnosis are shown with numbers in brackets indicating group size. MB-RIG patients displayed a wider distribution regarding the age at RIG diagnosis and latency period. RIG radiation-induced glioma, MB-RIG post-medulloblastoma RIG, ALL-RIG post-ALL RIG.

