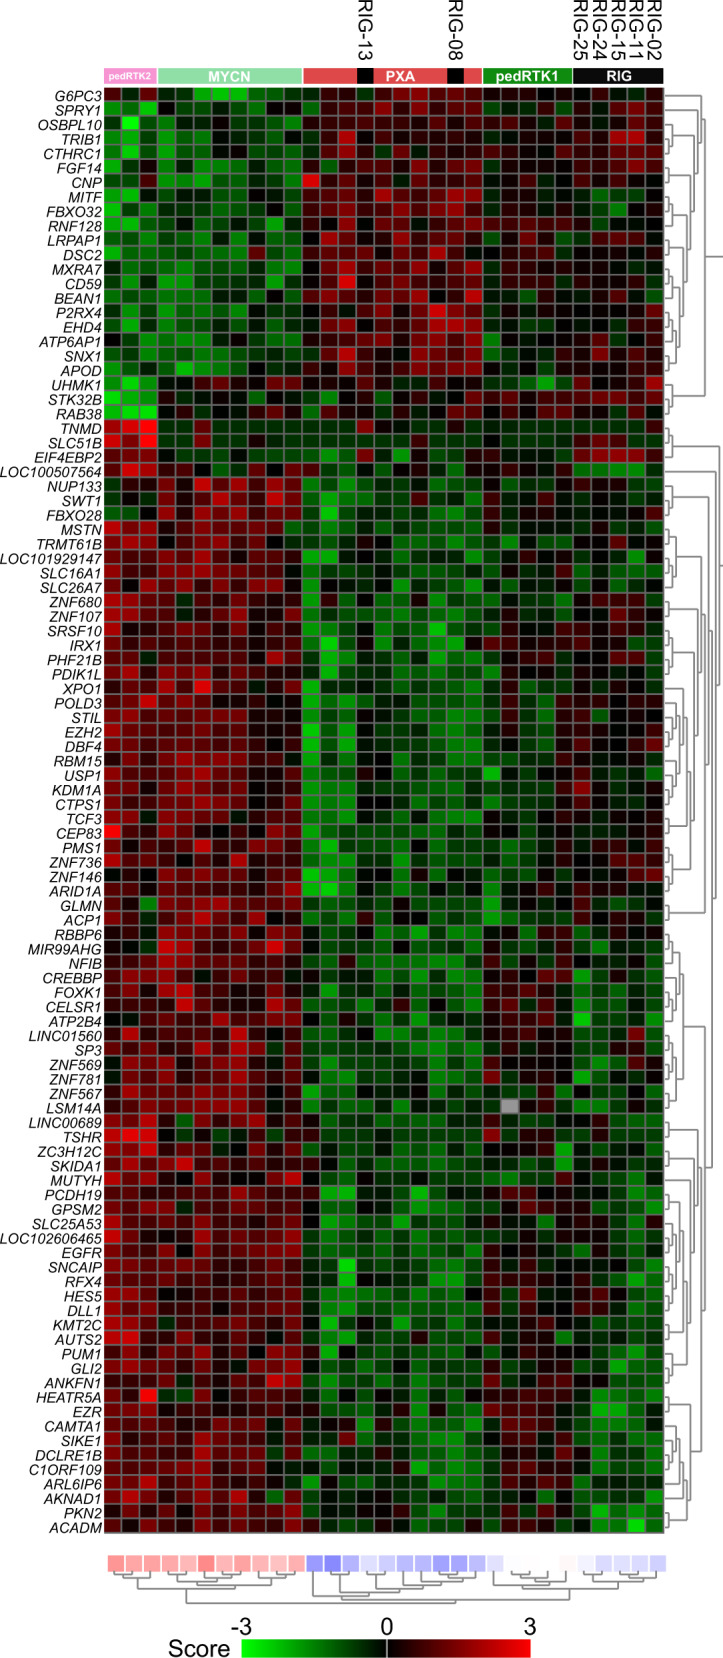
Fig. 7. Heatmap representing the expression levels of the 100 most significant, differentially expressed genes comparing RIG samples with reference groups (PXA, pedGBM_RTK1, pedGBM_RTK2, and pedGBM_MYCN).

Unsupervised hierarchical clustering reveals that gene expression profiling reflects our aforementioned findings based on DNA methylation profiling, with most RIGs resembling the pedGBM_RTK1 subgroup and a small subset more similar to PXAs. Each column represents one sample and each lane represents one gene. Expression levels are indicated by a color scale as indicated. PXA pleiomorphic xanthoastrocytoma, pedGBM_RTK1 pediatric glioblastoma subclass RTK1, pedGBM_RTK2 pediatric glioblastoma subclass RTK2, pedGBM_MYCN pediatric glioblastoma subclass MYCN.
