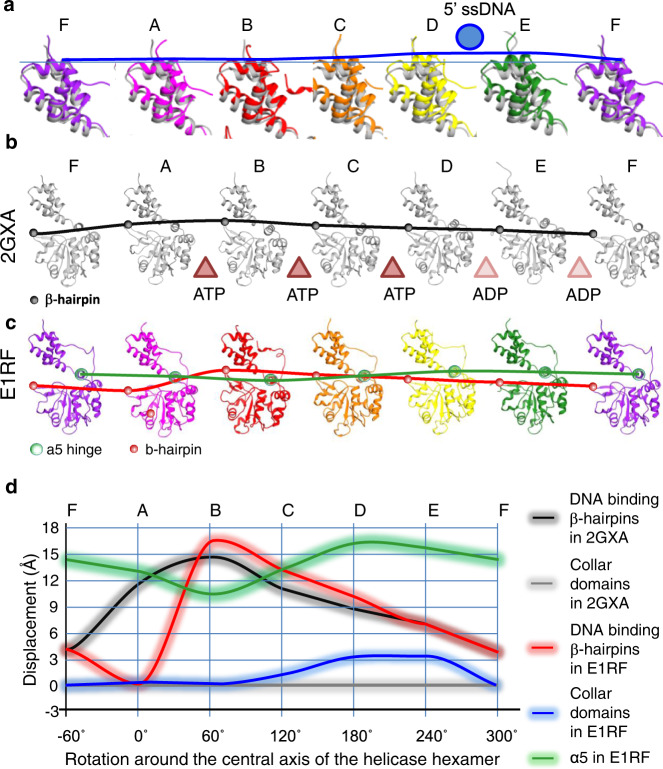
Fig. 7. Positional variation of the subunit domains in E1RF.
a A tiled representation of the atomic models of the E1RF collar domains (rainbow) overlaid with the corresponding domains of the E1HD/ssDNA/ADP X-ray structure (in grey). The blue curve indicates the collar domain shifts in the EM structure compared to the X-ray structure, which reaches a maximum under the 5’ ssDNA (blue circle). b A black curve traces the shifts in the DNA-binding β-hairpins in the X-ray structure; nucleotide states at the subunit interfaces are indicated with brown (ATP) or pale brown (ADP) triangles. c Curves tracing the movement of the α5 hinge (green) and DNA binding β-hairpins (red) in E1RF. d Graphical representation of the displacements of the collar domains, the β-hairpins and the α-5 hinge point of the E1RF subunits relative to the corresponding subunits in the X-ray structure. The accuracy of the measurements is indicated by the thickness of the curves.

