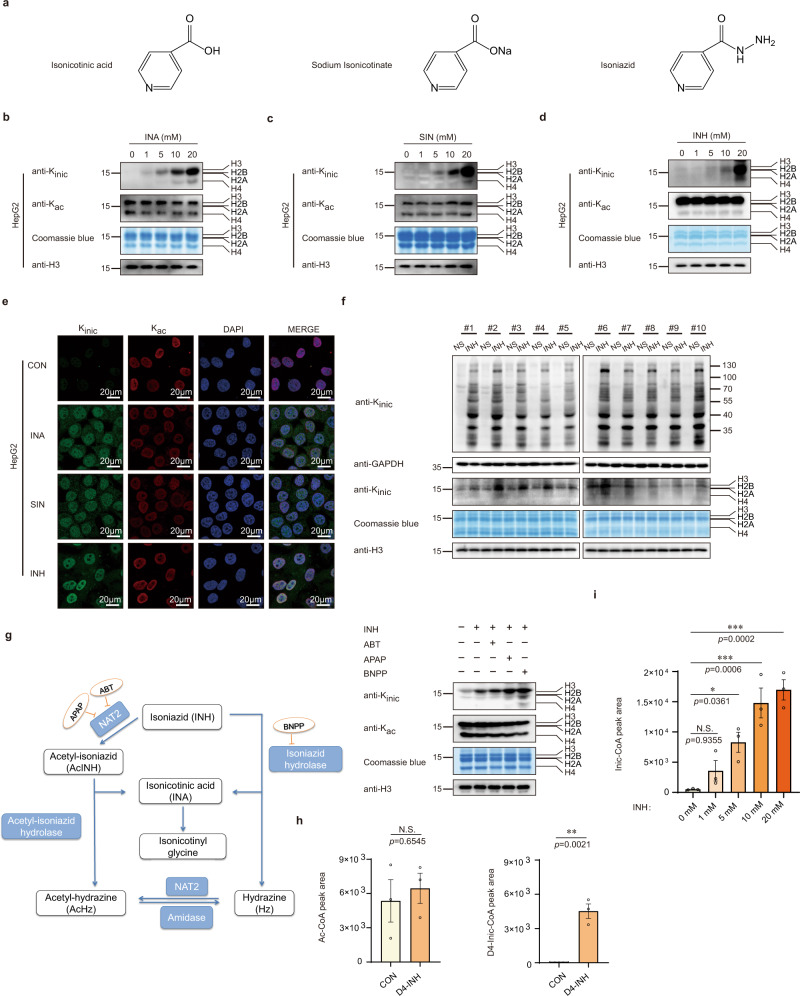
Fig. 2. INH stimulates histone Kinic in cells and mice.
a–e INA, SIN, and INH stimulate HepG2 histone Kinic. a Chemical structures of isonicotinic acid (INA), sodium isonicotinate (SIN), and isoniazid (INH). b Core histones acid-extracted from HepG2 cells that treated with increasing concentration of INA for 24 h and tested using pan-Kinic, pan-Kac, and H3 antibodies by Western blot analysis. Total histones were visualized with Coomassie blue staining. “INA” indicates isonicotinic acid. c Core histones acid-extracted from HepG2 cells that treated with increasing concentration of SIN for 24 h and tested using pan-Kinic, pan-Kac, and H3 antibodies by Western blot analysis. Total histones were visualized with Coomassie blue staining, “SIN” indicates sodium isonicotinate. d Core histones acid-extracted from HepG2 cells that treated with increasing concentration of INH for 24 h and tested using pan-Kinic, pan-Kac, and H3 antibodies by Western blot analysis. Total histones were visualized with Coomassie blue staining, “INH” indicates Isoniazid. e HepG2 cells were treated with 10 mM INA, SIN, and INH respectively for 24 h and stained with pan-Kinic rabbit (green) and pan-Kac mouse (red) antibodies. Nuclei were stained with DAPI (blue), followed by visualization with confocal microscopy. Scale bar, 20 μm. f INH stimulates mice liver Kinic levels. Liver samples from mice treated with normal saline (NS) or 50 mg/kg/day of INH for ten days were collected (n = 10 mice each group). And core histones and non-histones were extracted and tested using pan-Kinic, GAPDH and H3 antibodies by Western blot. Total histones were visualized with Coomassie blue staining. “NS” indicates normal saline treated mice, “INH” indicates isoniazid treated mice. g INH is like to stimulate histone Kinic directly. Schematic diagram of INH metabolism in vivo (left), core histones acid-extracted from normal HepG2 cells, 1 mM ABT (1-Aminobenzotriazole), 5 mM APAP (Acetaminophen) or 15 mM BNPP (Bis-p-nitrophenyl phosphate) pretreated HepG2 cells respectively, and also treated with 10 mM INH for 24 h, then tested using pan-Kinic, pan-Kac and H3 antibodies by Western blot analysis. Total histones were visualized with Coomassie blue staining (right). h–i INH stimulates the production of Inic-CoA. h CoA was extracted from HepG2 cells treated with or without D4-INH (PH = 7.4) for 24 h, then tested the Ac-CoA (left) and D4-Inic-CoA (right) levels using HPLC-MS/MS assay, “CON” indicates untreated HepG2 cells; “D4-INH” indicates D4-isoniazid treated HepG2 cells, quantifications of the chromatographic peak area, data presented are the mean ± SEM from three biological replicates (n = 3), as determined by unpaired two-tailed Student’s t-test. i CoA was extracted from HepG2 cells treated with increasing concentration of INH (PH = 7.4) for 24 h, and tested the Inic-CoA levels using HPLC-MS/MS assay, quantifications of the chromatographic peak area, data presented are the mean ± SEM from three biological replicates (n = 3), as determined by one-way ANOVA followed by Bonferrroni’s multiple comparisons test.

