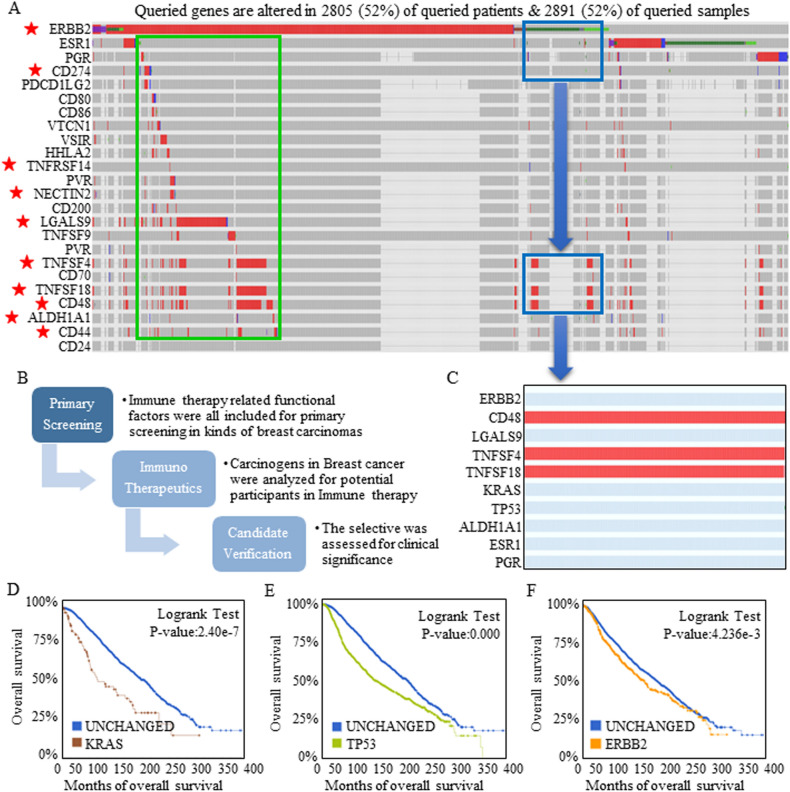
Figure 2.
Selection of the most representative immune checkpoint molecules targeted by blockade. Expression signatures and correlations were studied using cBioPortal and GEPIA2. (A) Expression heat-map showing the expression of each candidate in a red bar, and the most representative genes are labeled with a red star. The red bars indicate actual data points, and the gray bars indicate that no specific data were available. (B) The analysis flowchart is shown. (C) Nearly all the immunotherapeutic targets showed expanded expression intervals referring to ESR1 and PGR, and TNFSF4, TNFSF18, and CD48 showed increased expression in breast carcinomas without ERBB2, ESR1, and PGR expression. Amplification or mutation of KRAS (D), TP53 (E), or ERBB2 (F) indicated worse predicted survival.

