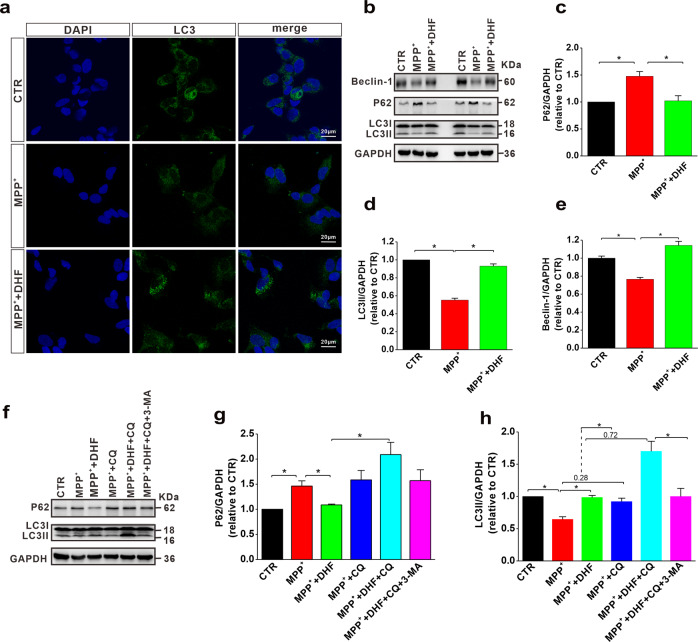
Fig. 4. DHF induces autophagy in MPP+-treated N2A cells.
a Immunofluorescence analysis of LC3 to evaluate autophagy in N2A cells. b–e The protein levels of P62 (c), LC3 (d), and Beclin-1 (e) assessed by western blot in N2A cells subjected to MPP+ treatment with or without DHF. f–h The protein levels of P62 (g) and LC3 (h) assessed by western blot in MPP+-treated N2A cells with or without co-administration of DHF and CQ or 3-MA. Data are expressed as mean ± SEM. *P < 0.05.

