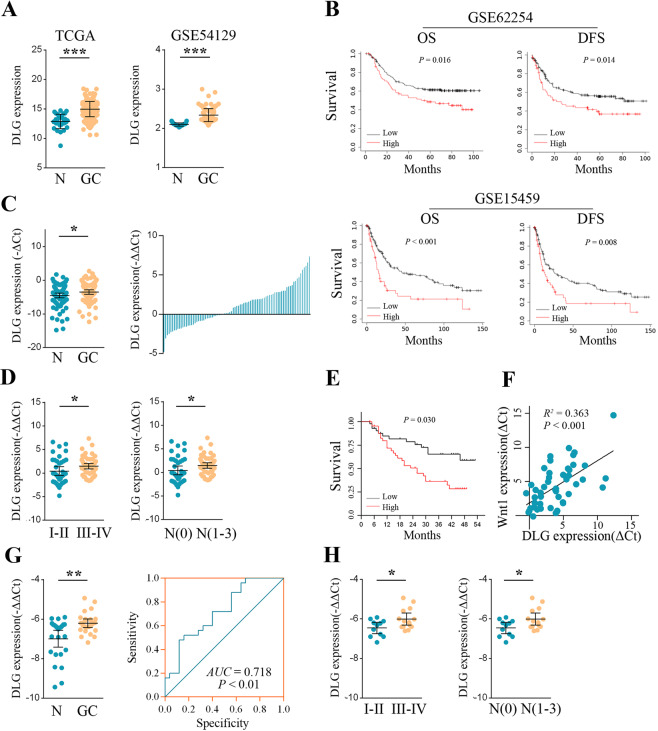
Fig. 1. DLGAP1-AS2 was upregulated in GC.
A Relative expression of DLGAP1-AS2 in GC compared with normal tissue was analyzed by using the TCGA database and GSE54129 dataset. B Kaplan–Meier analysis of OS and DFS in GSE662254 and GSE15459 datasets. C RT‐qPCR assay for the expression of DLGAP1-AS2 in 85 paired GC tissues and adjacent non-cancerous tissues. D The correlation between tissue DLGAP1-AS2 level and TNM stage as well as lymphatic metastasis. E Kaplan–Meier analysis of OS according to the median expression level of DLGAP1-AS2 in GC patients. F The correlation between DLGAP1-AS2 and Wnt1 expression was determined by Pearson correlation analysis. G The expression of DLGAP1-AS2 in plasma from 25 GC patients and paired healthy donors. The accuracy for plasma DLGAP1-AS2 in the diagnosis of GC was analyzed by the ROC curve. H The correlation between plasma DLGAP1-AS2 and TNM stage or lymphatic metastasis. DLG: DLGAP1-AS2. *P < 0.05, **P < 0.01, ***P < 0.001.

