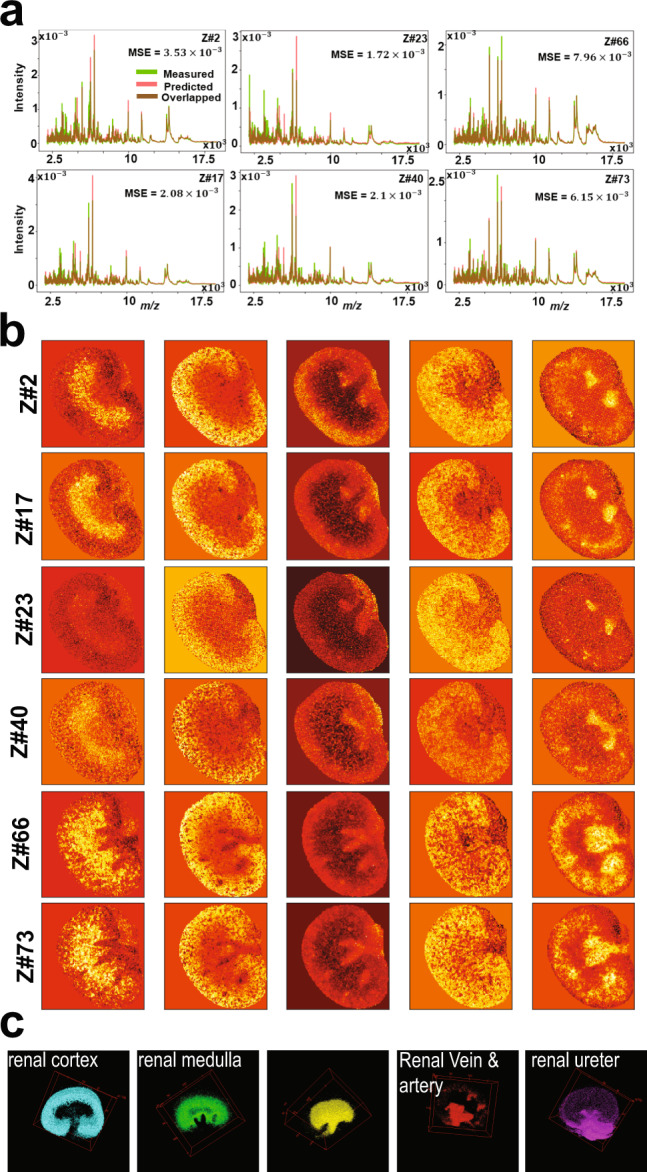
Fig. 5. Analysis of 3D MALDI MSI test dataset of mouse kidney.

Analysis of 3D MALDI MSI test dataset of mouse kidney of total 72 tissue sections in which spectra of each 2D MSI dataset were independently analyzed: a distribution of average spectrum of both TIC-normalized original and predicted data of six datasets samples at different volumetric tissue depth (z-direction). b Low dimensional encoded features capture molecular structures from original high-dimensional data. c 3D distribution of distinct clusters in the entire dataset that were identified by clustering the encoded features of the entire dataset using GMM (k = 8) and each cluster represents a molecular pattern that reconciles the kidney’s anatomy.
