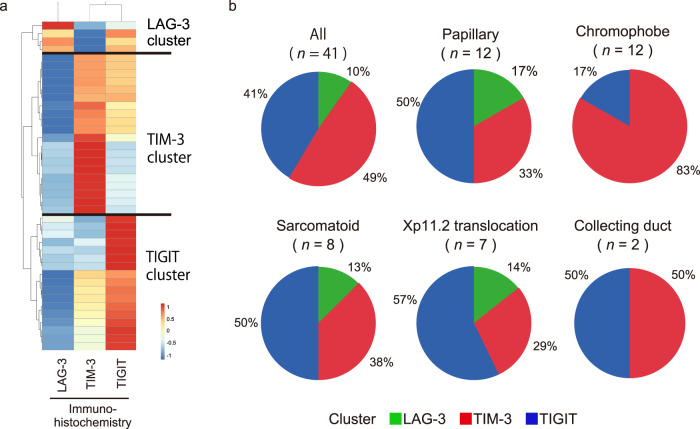
Fig. 4. Histological subtype-specific differences underlying the phenotypic signatures of the new IRs (LAG-3, TIM-3, and TIGIT).
a Hierarchical clustering heatmap (low, blue; high, red) using positive-stained cell densities of LAG-3, TIM-3, and TIGIT in 41 non-ccRCC samples. Data were normalized prior to clustering. Samples were obtained from the papillary (n = 12), chromophobe (n = 12), sarcomatoid (n = 8), Xp11.2 translocation (n = 7), and collecting duct (n = 2) subtypes. b Inferred IR cluster distributions obtained in (a) by histological subtype.

