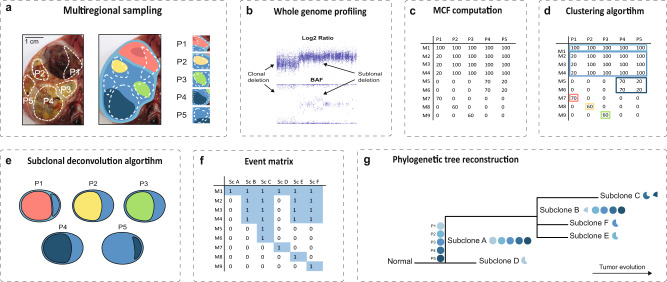
Fig. 1. Overview of the methodological outline.
a An example of multiregional sampling to obtain biopsies P1-P5 from a Wilms tumor. The tumor is composed of several subclones with distinct genomic profiles, exemplified by the schematic genomic landscape in the rightmost panel where each color unifies cells with identical sets of genetic alterations. The photograph is adapted from a previous publication14 and the colors do not represent true sets of genetic alterations. b Acquisition of genomic tumor data for each sample, exemplified by copy number analysis by SNP-array. c The whole genome profiling data can be used to compute the mutated clone fraction (MCF) illustrating the proportion of cells in each biopsy harboring a certain genetic alteration (M1-9 in the left column). d A clustering algorithm is employed to identify genetic alterations that seem to follow each other in size across samples. e A subclonal deconvolution algorithm determines the temporal order of these clusters by considering the information obtained throughout all samples while minimizing the occurrence of parallel evolution and back mutations. f The proposed solution for the temporal order of subclones (Sc) is integrated into an event matrix. g This event matrix can be used to generate phylogenetic trees with either the maximum likelihood or the parsimony method. At the stem, all available biopsies for the patient are visualized as filled circles with the biopsy name (P1–P5). At the branches of the tree the subclones can be seen along with pie charts illustrating in which biopsies, and in what fraction of the tumor cells they appear.

