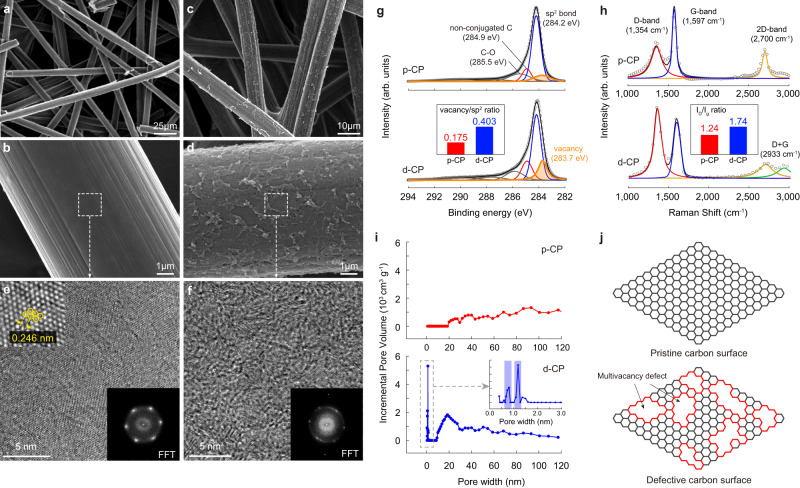
Fig. 2. Atomistic structure of the defective carbon layer.
a–d SEM images of p-CP (a, b) and d-CP (c, d). e, f HR-TEM images and corresponding FFT patterns for p-CP (e) and d-CP (f). g C 1s HR-XRS spectra for p-CP and d-CP. The binding energy in XPS was calibrated with the C 1s sp2 peak at 284.2 eV. (Inset: Comparison of the vacancy/sp2 ratio determined by dividing the area of the vacancy peak by that of the sp2 peak between p-CP and d-CP). h Raman spectra for p-CP and d-CP. (Inset: Comparison of ID/IG ratio calculated by dividing the area of the D-band by that of the G-band between p-CP and d-CP) i BJH pore size distribution analysis for p-CP and d-CP. Inset is the magnified micropore region for d-CP. j Schematic illustrations of the atomistic structure of the p-CP and d-CP surfaces. The red line indicates the MV defects of d-CP.

