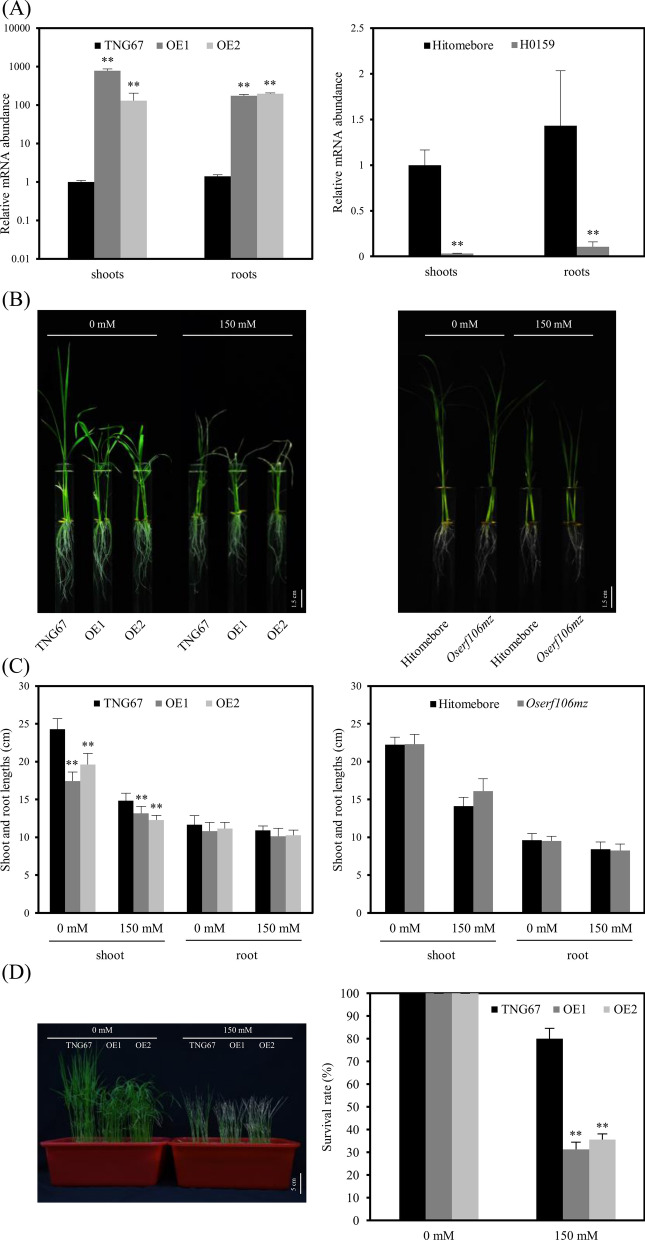
Fig. 3.
A comparison of growth patterns and salinity stress responses among OsERF106MZ-overexpressing transformants (OE1 and OE2), the Oserf106mz mutant, and the corresponding WT cultivars under normal (0 mM NaCl) and NaCl-treated (150 mM NaCl) conditions. a Quantification of OsERF106MZ mRNA levels in OsERF106MZ-overexpressing transformants, the Oserf106mz mutant, and the corresponding WT cultivars by qPCR. The positions of the primers are indicated by purple arrows in Additional file 1: Figure S9A. The primer sequences are listed in Additional file 2: Table S1. The seedlings were grown on basal medium for 11 days and then subjected to qPCR assays. b Morphological appearance of the OsERF106MZ-overexpressing transformants, Oserf106mz mutant, and the corresponding WT cultivars. c The shoot and root lengths of the OsERF106MZ-overexpressing transformants, Oserf106mz mutant, and the corresponding WT cultivars. d Morphological phenotype and survival rate of the OsERF106MZ-overexpressing transformants and its corresponding WT cultivars. The seedlings used for the assessment of morphological characteristics such as shoot and root lengths (b and c) and the calculation of survival rates (d) were grown on basal medium for 7 days and then transferred to basal medium containing 0 or 150 mM NaCl for an additional 4 and 6 days, respectively. The values of shoot and root lengths (c) are the mean ± SE of at least five biological replicates, each with two technical replicates. All survival rates (d) are the mean ± SE of 4 independent biological replicates. Each biological replicate contains at least 20 seedlings. Asterisks indicate significant differences (*P < 0.05 and **P < 0.01) in comparison to the corresponding WT based on Student’s t-test

