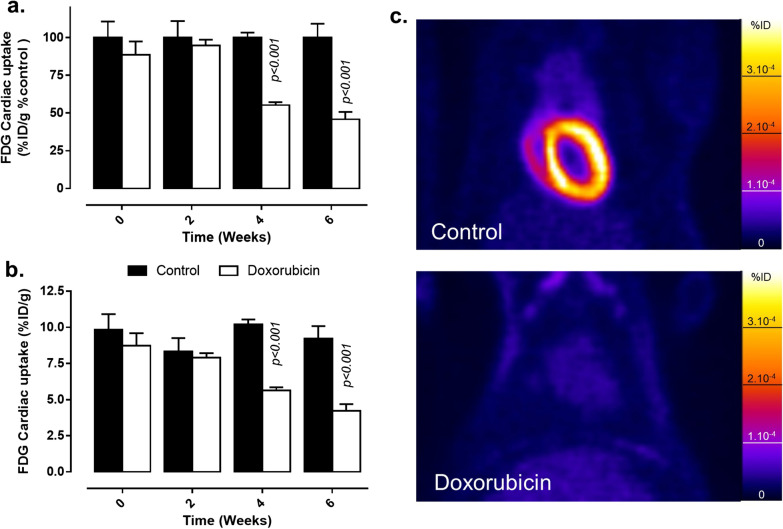
Fig. 4.
Evaluation of cardiac [18F]FDG uptake in vehicle and doxorubicin-treated rats measured on PET images. Cardiac [18F]FDG uptake monitoring during the 6 weeks of experimental protocol. Data are expressed as % ID/g related to control group (a) and %ID/g (b) and as mean ± SEM. p values presented on graphs are comparisons between control and doxorubicin groups c. Representative cardiac-centered coronal views of [18F]FDG PET images in control (upper panel) and doxorubicin-treated rats (lower panel) obtained at 6 weeks

