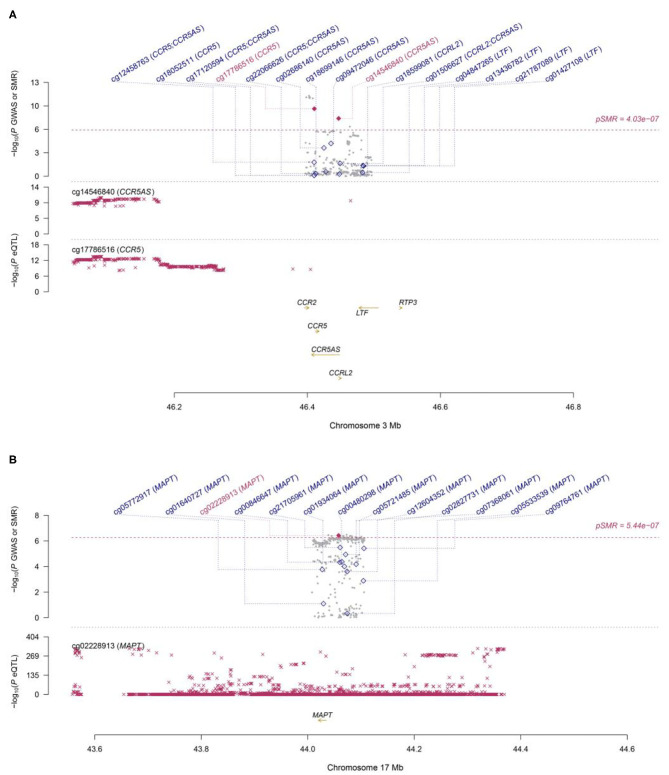
Figure 2.
Two loci from the SMR analysis. (A): Top plot, gray dots represent the P-values for SNPs from the COVID-19 GWAS. Bottom plots, the mQTL P-values of SNPs from the Hannon study for the cg14546840 and cg17786516 probes tagging CCR5 and CCR5AS, respectively. Highlighted in red are the genes (CCR5 and CCR5AS) that passed the SMR and HEIDI tests. (B): Top plot, gray dots represent the P-values for SNPs from the COVID-19 GWAS. The bottom plot, the mQTL P-values of SNPs from the LBC-BSGS study for the cg02228913 probe tagging MAPT. Highlighted in red is the gene (MAPT) that passed the SMR and HEIDI tests.

