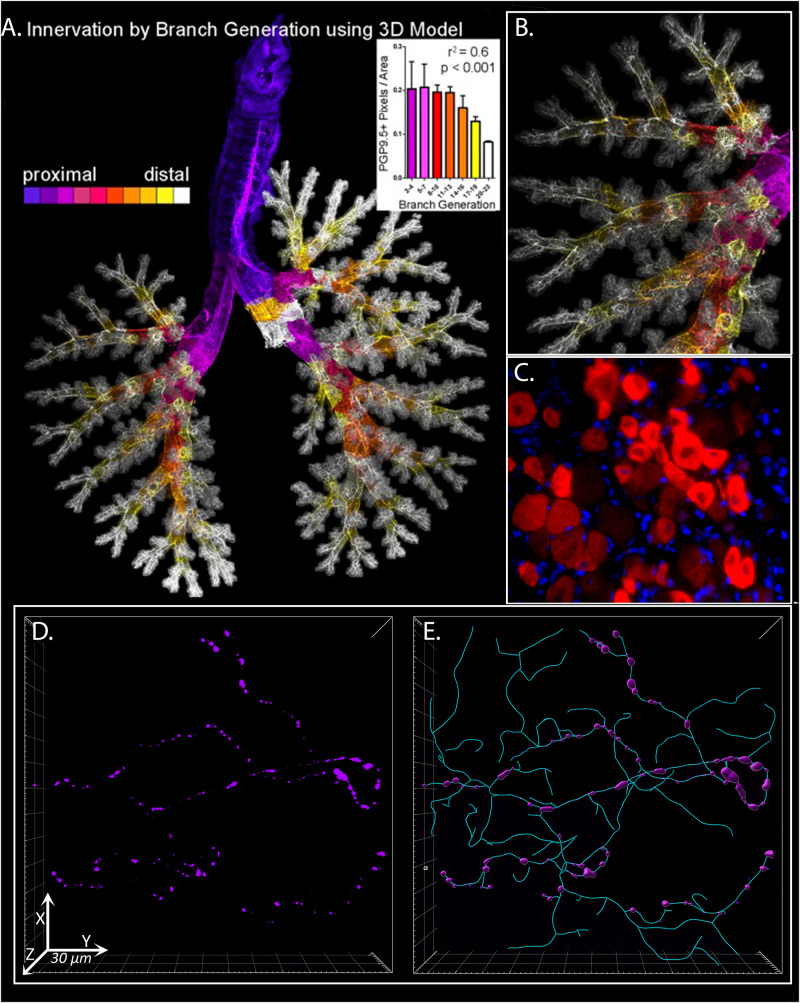
FIGURE 1.
3D Analysis of Sensory Innervation of the Lung. Mouse and human airway nerves are labeled and imaged using immunofluorescence and confocal microscopy. (A) Flattened image of mouse lungs with nerves identified using antibodies against the pan-neuronal protein PGP9.5. Color-coding is based on airway generation from proximal (purple) to distal (white). Nerve density in each generation was calculated (inset). (B) Higher magnification image of airway shown in (A). (C) Mouse vagal ganglion with purinergic P2X3 receptor expression in red. (D) Human airway neuronal substance P expression (purple) in bronchoscopic airway biopsy from a patient with chronic cough. (E) Computer modeling and morphometric analysis of total sensory innervation based on PGP9.5 (cyan) and distribution of substance P (purple) in image from (D). (A,B) Scott et al. (2014) reprinted with permission of the American Thoracic Society. Copyright© 2021 American Thoracic Society. All rights reserved. The American Journal of Respiratory Cell and Molecular Biology is an official journal of the American Thoracic Society. (D,E) From ref. Shapiro et al. (2021) adapted with permission of the American Thoracic Society. Copyright© 2021 American Thoracic Society. All rights reserved. The American Journal of Respiratory and Critical Care Medicine is an official journal of the American Thoracic Society. Readers are encouraged to read the entire article for the correct context at https://www.atsjournals.org/doi/full/10.1164/rccm.201912-2347OC. The authors, editors, and The American Thoracic Society are not responsible for errors or omissions in adaptations.

