Figure 5.
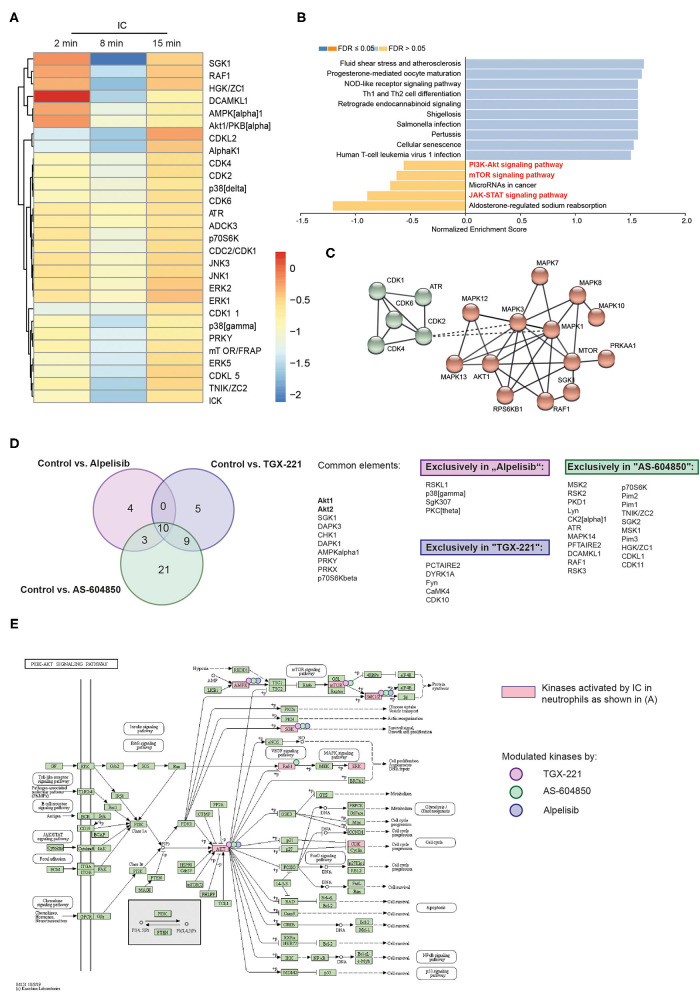
Unique impact of different PI3K inhibitors on downstream kinase activation. Freshly isolated human blood PMNs were activated with IC for 0, 2, 8, or 15min. Cells were lysed and the PTK and STK activity was measured by PamGene. (A) Heatmap of mean kinase statistic in comparison to unstimulated cells (0min). Blue: Kinase activity decreased/Red: Kinase activity increased. (B) Enriched KEGG pathways (as shown by Webgestalt) after IC-stimulation. (C) String network for IC-stimulated kinases (MCL clustering, inflation parameter 3) (D) Venn diagram and summary of the common and uniquely regulated kinase activities after use of three PI3K isoform-selective inhibitors that were effective in experimental EBA (alpelisib, AS-604850 and TGX-221). The comparison was performed for all time points with direct comparison to the kinase activity of ICs activated PMNs treated with solvent. (E) Influence of PI3K inhibition on PI3K/Akt and mTOR pathways, kinases regulated by ICs (cumulative stimulation for 2, 8, and 15min using PamGene) are shown in bright red. Kinases, that are regulated by the respective kinase inhibitors are marked with a reddish dot (TGX-221), green dot (AS-604850), and purple dot (alpelisib). Data is based on 3 replicates per group.

