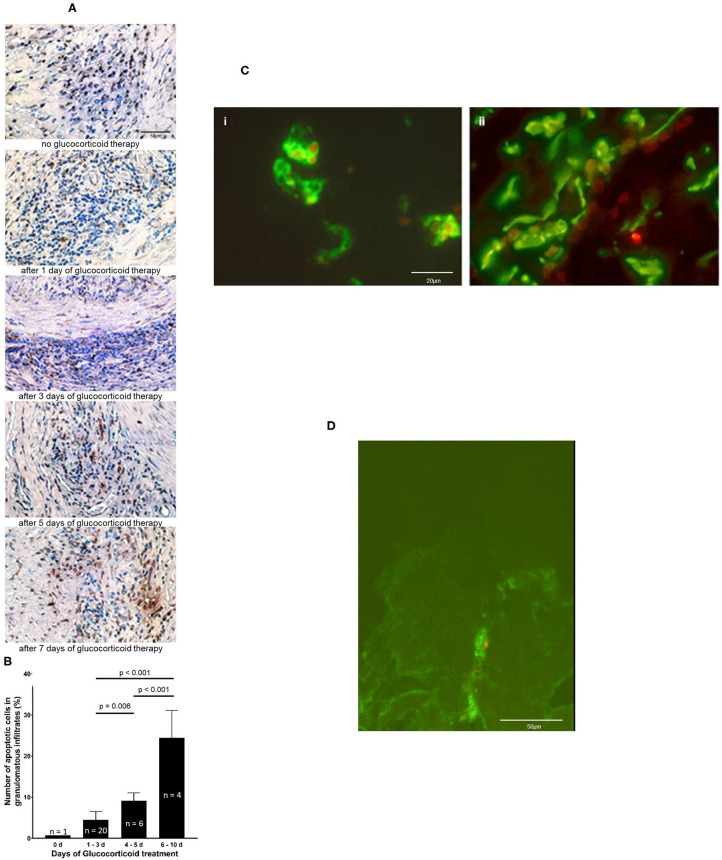
Figure 2.
Glucocorticoid therapy induces apoptosis. (A) DNA fragmentation of apoptotic cells (brown stain) is demonstrated by applying TUNEL assay on temporal artery sections of five GCA patients. Nuclei were stained with haematoxylin and eosin. Scale bar = 50 μm. (B) The number of TUNEL-positive cells was quantified in 31 paraffin-embedded consecutive temporal artery specimens. For each patient and control patient, TUNEL-positive cells and nuclei of all cells in four random fields (magnification 100 × ) of each specimen were counted. The percentages of TUNEL-positive cells of all cells in the samples were calculated. (C) Demonstration of intracellular DNA fragmentation in CD3+ cells (i) and CD68+ cells (ii) in a temporal artery biopsy specimen from a patient with GCA 5 days after glucocorticoid treatment. T cells and macrophages are stained with anti-CD3 mAb and anti-CD68 mAb (green fluorescene), respectively. Applying the ApopTag Red Kit, rhodamine-labeled DNA fragmentation (red fluorescene) was identified. Scale bar = 20 μm. (D) Demonstration of intracellular DNA fragmentation in tissue-residing DC in a temporal artery biopsy specimen from a patient with GCA 5 days after glucocorticoid treatment. Confocal microscopy reveals rhodamine-labeled DNA fragmentation (red fluorescence) within DC, that is stained with anti-S100 Ab (green fluorescence). Scale bar = 50 μm.

