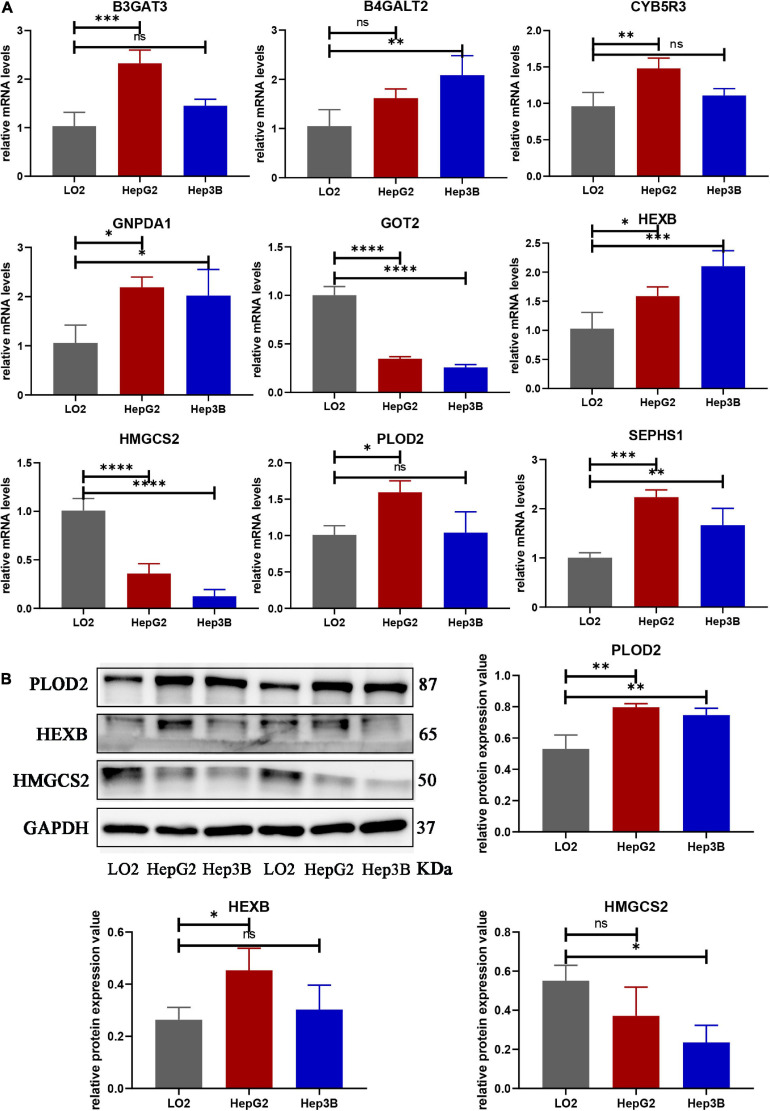
FIGURE 10.
The mRNA and protein expression of prognostic genes in LO2 cells, HepG2 cells and Hep3B cells. (A) The mRNA expression of nine genes analyzed by qRT-PCR. (B) The total protein expression of PLOD2, HEXB and HMGCS2 analyzed by western blot. Data are shown as mean ± SD, ∗p < 0.05, ∗∗p < 0.01, ∗∗∗p < 0.001, ****p < 0.0001 vs. LO2 cells.

